Report: Millennials experiencing record heat and extreme precipitation
As a result of global warming, young Americans today are growing up in a different climate than their parents and grandparents experienced. It is warmer than it used to be. Storms pack more of a punch. Rising seas increasingly flood low-lying land. Large wildfires have grown bigger, more frequent and more expensive to control. People are noticing changes in their own backyards, no matter where they live.
Pollution from burning coal, oil and gas is the primary cause of global warming. Without urgent action to reduce global warming pollution, children born today will grow up in a more dangerous world.
We can protect our children from the most harmful impacts of global warming by reducing carbon pollution and shifting to cleaner sources of energy. The United States has a critical window of opportunity to lead the world in this effort.
Table 1: Generations Defined

It is warmer than it used to be.
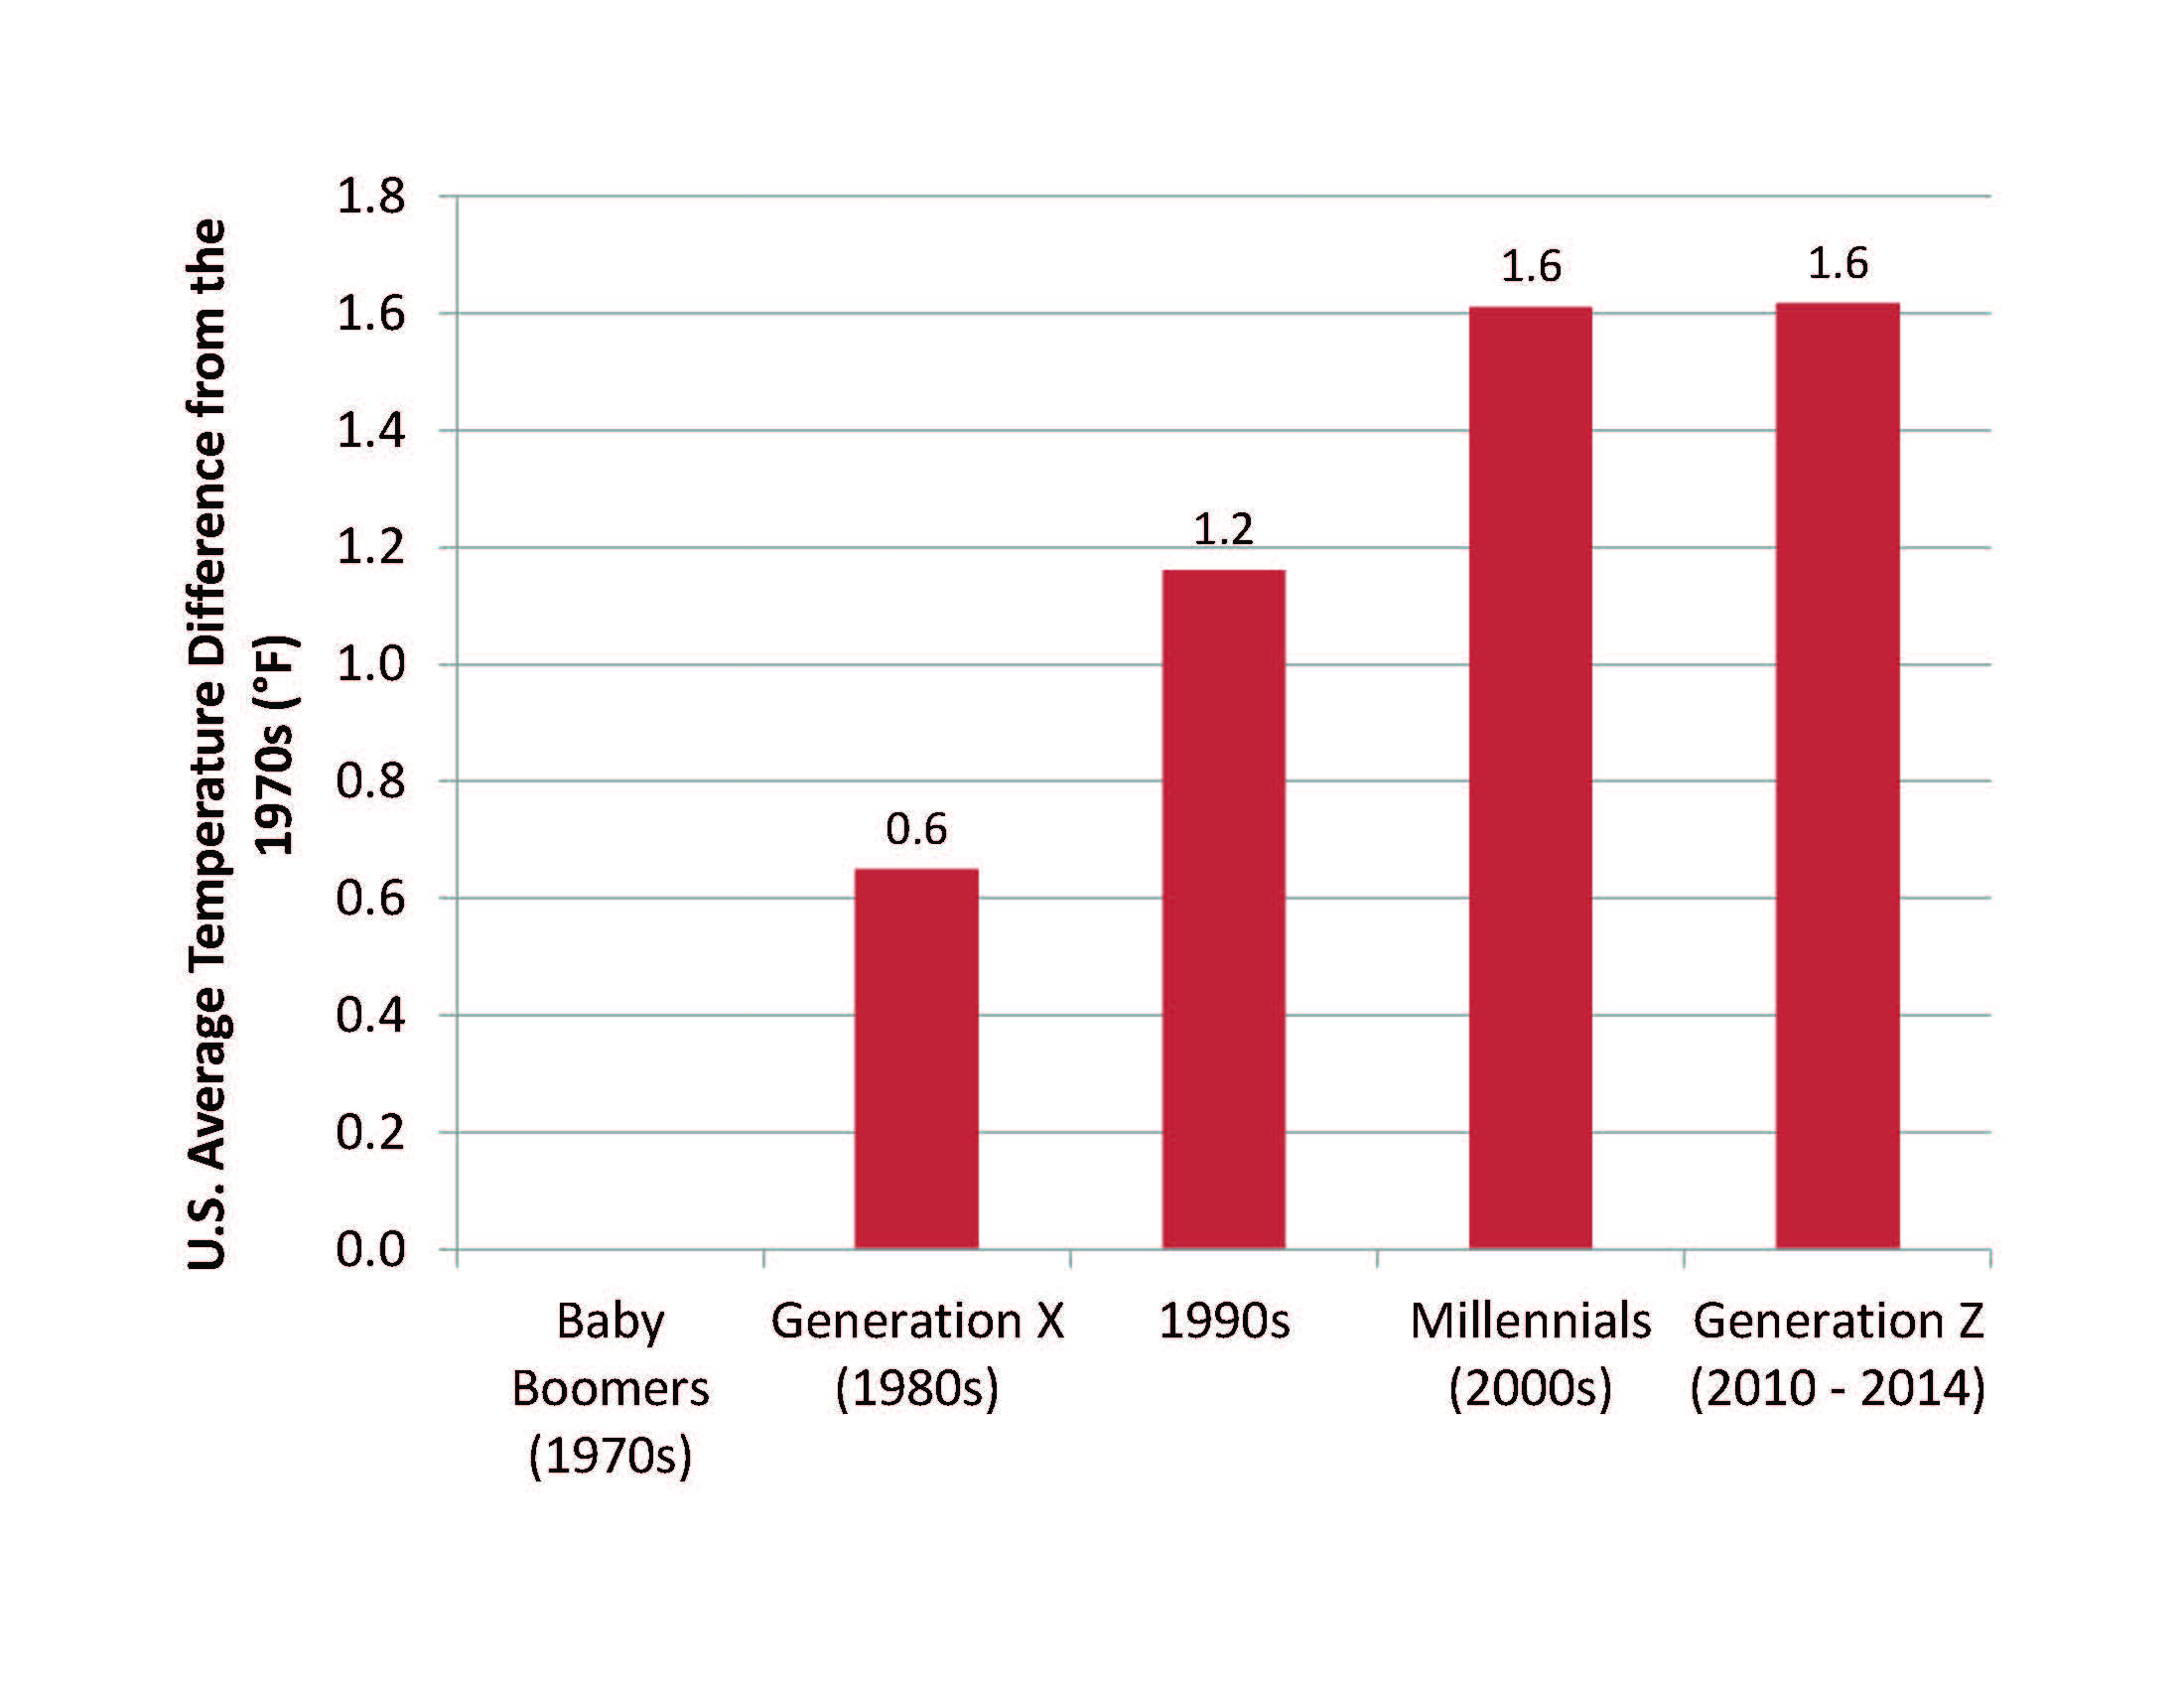
- When Baby Boomers were entering adulthood in the 1970s, the national average temperature was 52 degrees Fahrenheit (°F). So far, this decade has been 1.6 °F warmer across the contiguous United States. To put that into context, Rhode Island’s average temperature today is comparable to that of West Virginia in the 1970s; New Jersey’s average temperature to that of 1970s Missouri; and Delaware’s average temperature to that of 1970s Tennessee.
- The Millennial Generation entered adulthood during the hottest 10-year period in the last 100 years.
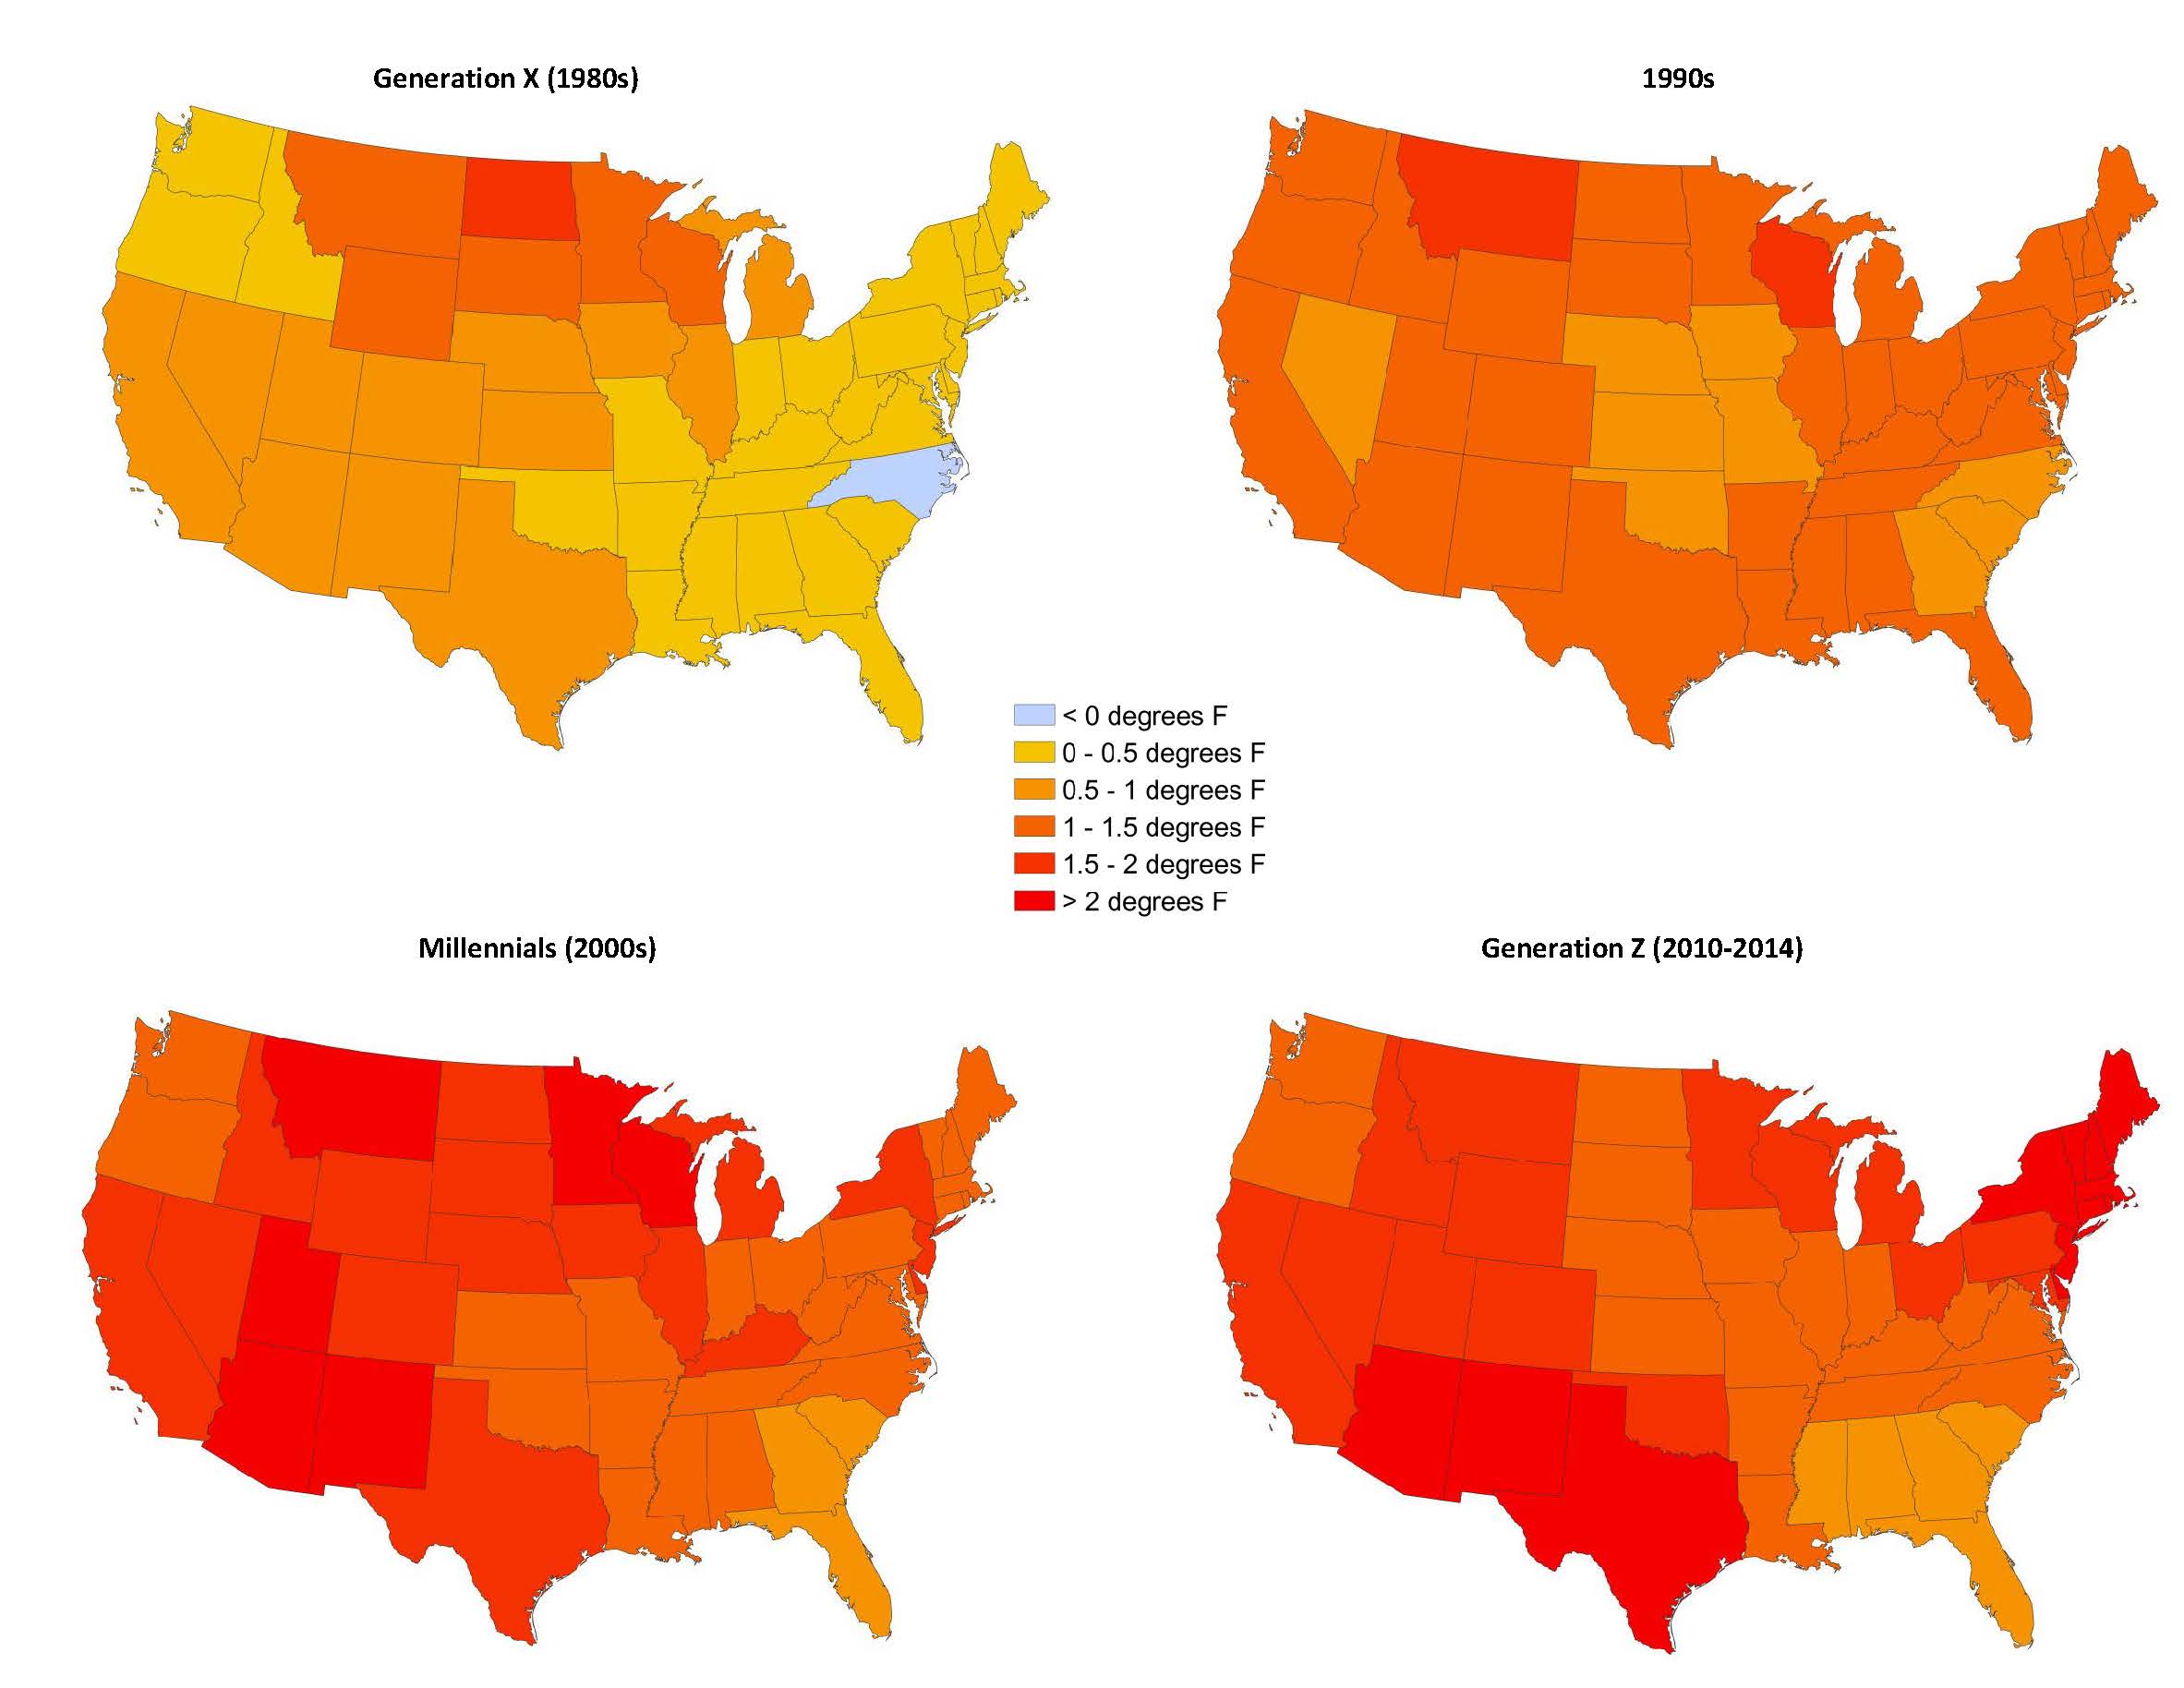
- In every state, young adults in the Millennial generation and Generation Z are experiencing warmer average temperatures than young adults in the Baby Boomer generation. (See Figure ES-2.)
Figure ES-1: Each Generation Has Grown Up in a Successively Warmer Climate

Figure ES-2: Higher Temperatures Are Affecting Generations Across the Country (Temperature Difference Since the 1970s) (°F)

The biggest storms are getting bigger.
- The biggest rain and snow storms produce 10 percent more rainfall in 2011 than they did in 1948.
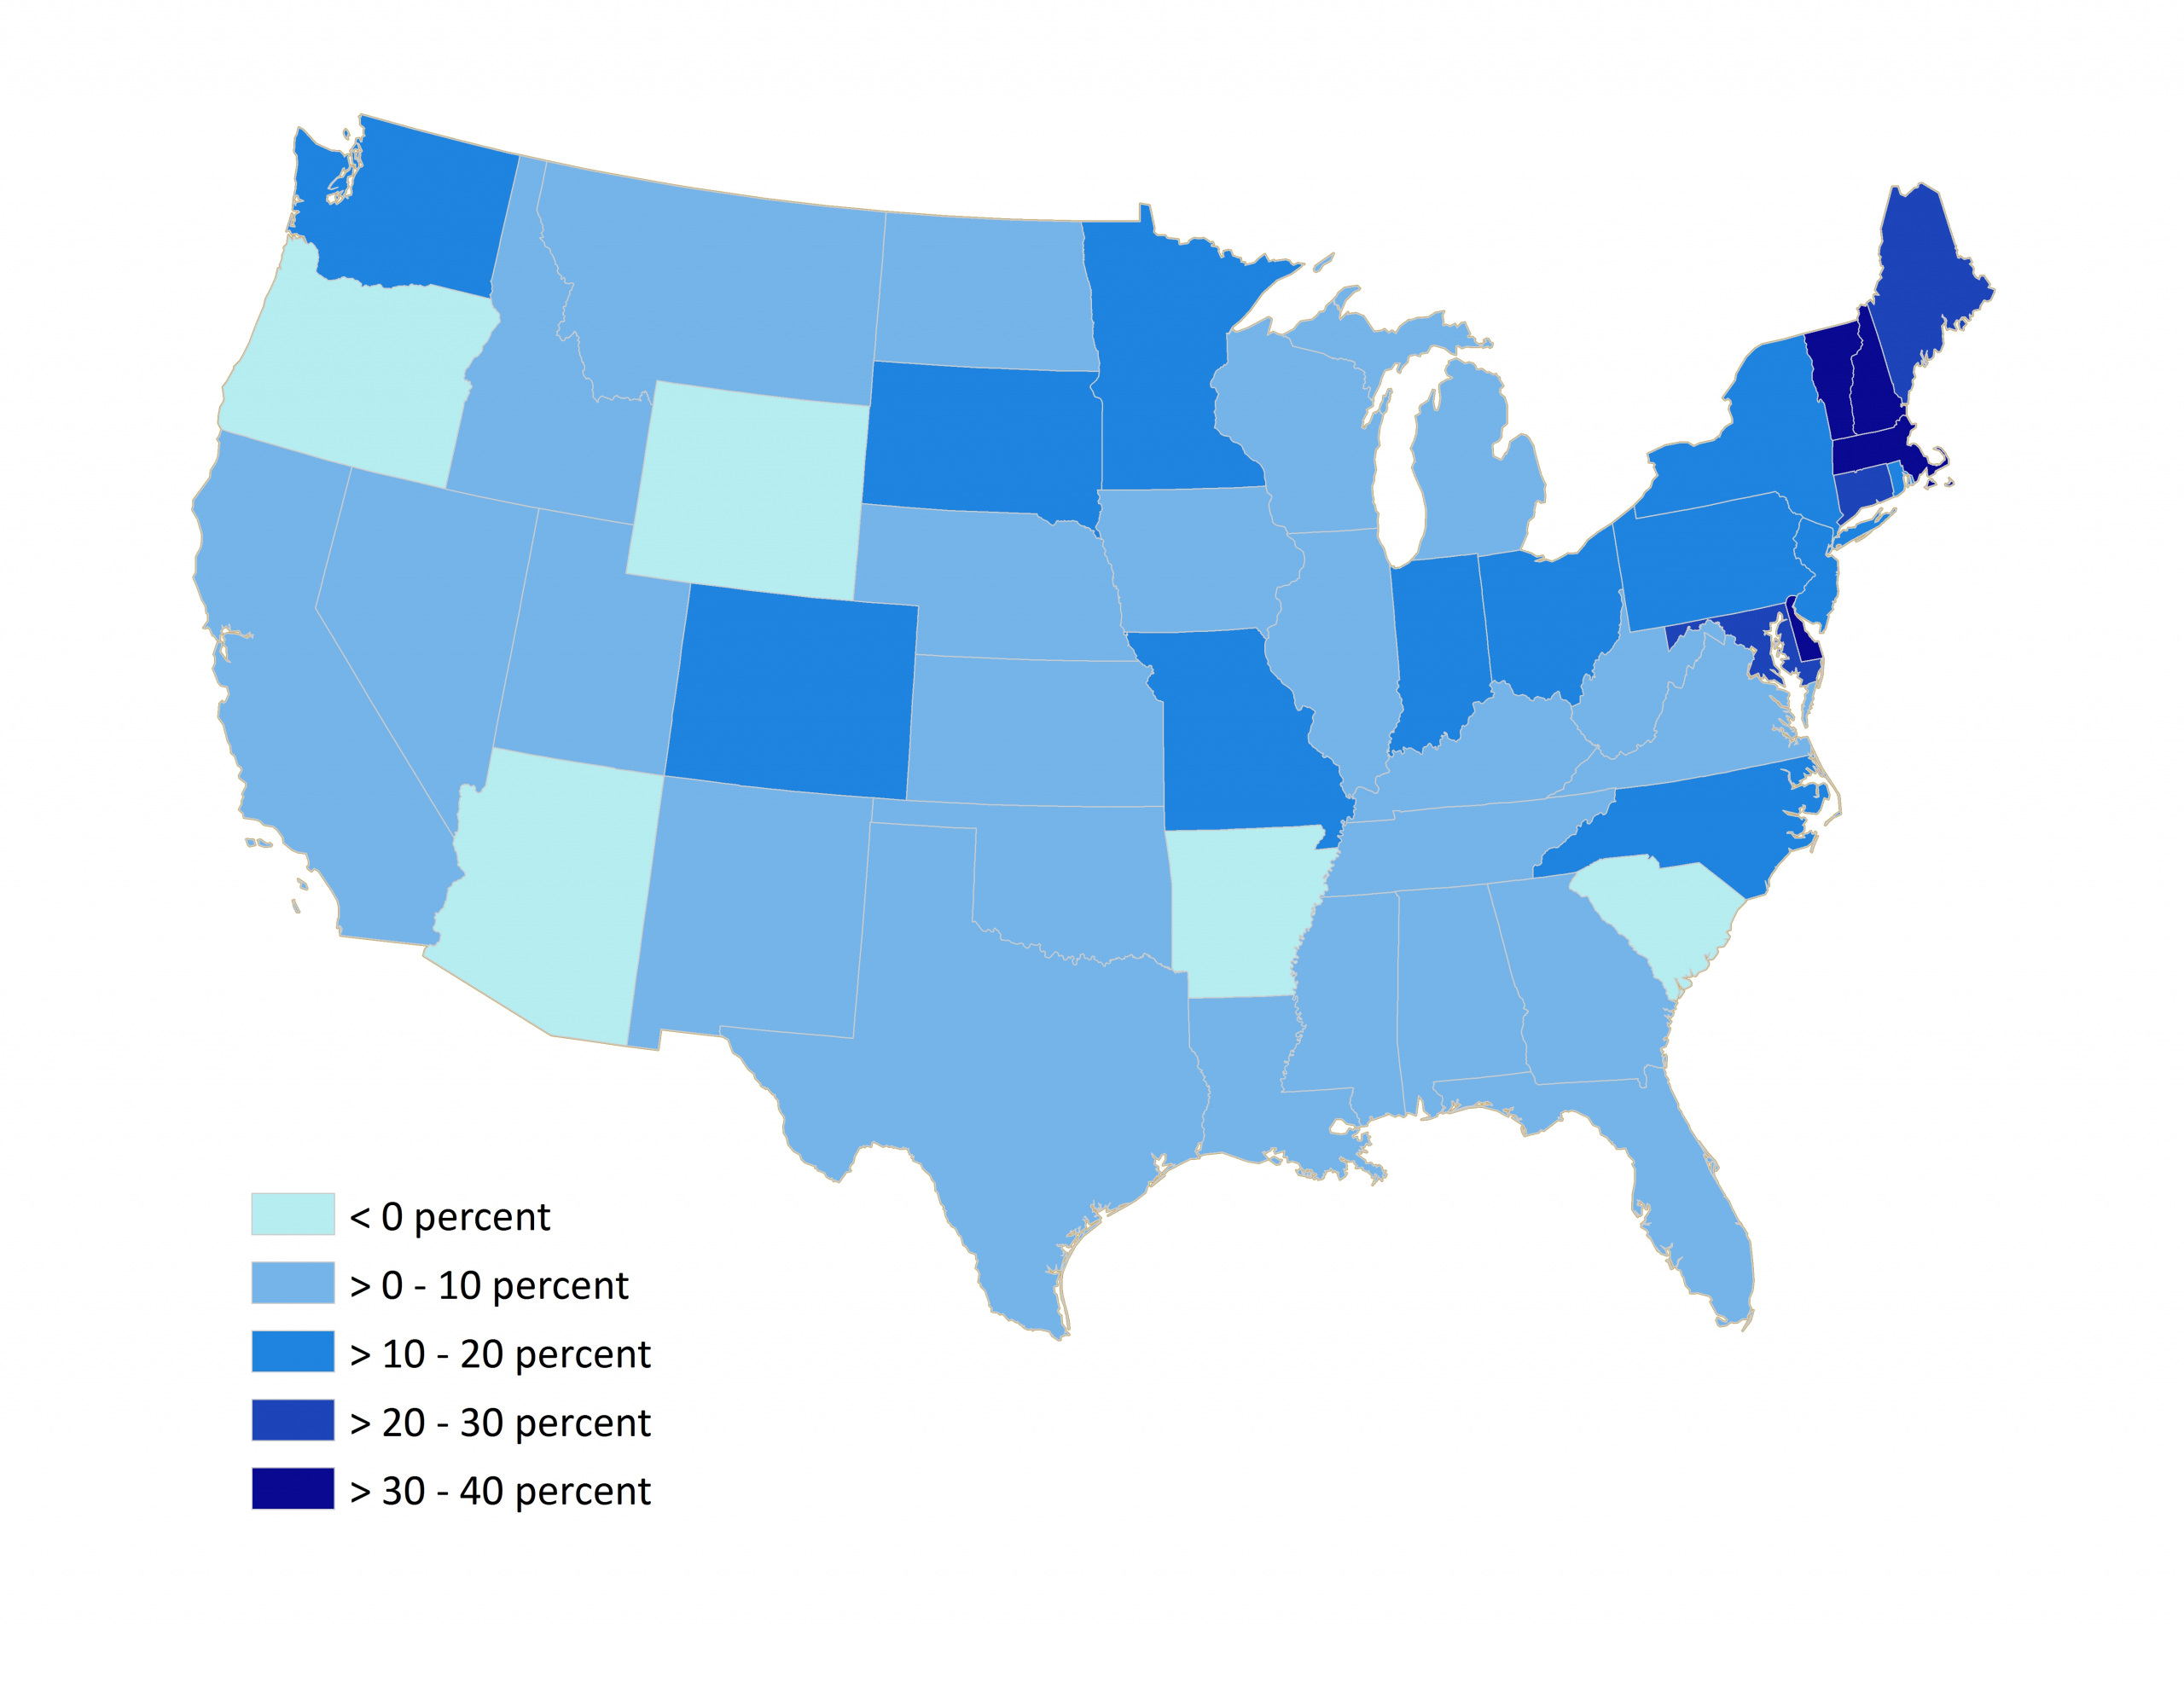
- Young members of Generation Z are experiencing bigger extreme storms than Baby Boomers did as young adults.* (See Figure ES-3 for state trends in the size of the biggest storms between 1970 and 2011.)
- Increases in extreme precipitation have been particularly pronounced in New England since 1970: in New Hampshire, members of Generation Z experience 40 percent more precipitation on average in the biggest rainstorms and snowstorms, and members of Generation Z in Massachusetts experience 34 percent more precipitation on average in the biggest storms.
Figure ES-3: The Biggest Storms are Getting Bigger (Percent Increase in Maximum Annual 24-hour Precipitation Totals by State, 1970 to 2011)

Sea level is rising as global warming heats up the oceans and melts glaciers and ice caps.
- Globally, sea level has risen 8 inches since the 1880s – rising at a faster rate than at any point in the last 2,000 years.
- U.S. coastal cities are experiencing sea level rise: in New York, Millennials came of age with seas 3.4 inches higher than in the 1970s. As a result, coastal flooding has become more frequent. Small floods that occurred every one to five years in the 1950s now are expected every 3 months on average at most tide gauges in the United States.
- Coastal Louisiana is experiencing significant land subsidence, which is accelerating relative sea-level rise to rates higher than anywhere else in the world. Between rising seas, sinking land and other human-caused disturbances, Louisiana has lost 1,880 square miles of coastal land since the 1930s.
Warming threatens our health and safety and puts our children at risk.
- The warming that has happened over the past four decades has increased the risk of heat-related illness, floods, drought, crop failure, wildfires and infrastructure damage. If the United States and the world continue to emit more carbon pollution, by the end of the century (when today’s children will be reaching retirement age) temperature will have risen 5-10 °F, greatly magnifying the risks we face.
- Scientists predict with “a high degree of certainty” that the United States will be more frequently impacted by heavy precipitation events as the world continues to warm, putting today’s children at risk of floods, waterborne disease and crop failure.
- Global sea level could rise 1.9 to 3.6 feet by 2100, with some parts of the U.S. coast experiencing faster rates of sea-level rise. Sea-level rise and land subsidence put more than $1 trillion worth of U.S. coastal buildings at risk of flooding in the next century, and the National Flood Insurance Program predicts that the number of flood insurance policyholders will increase by 80 percent by 2100.
To protect our children from the worst impacts of global warming, the United States must cut its overall emissions of global warming pollution by at least 80 percent below 2005 levels by 2050, as part of global action to dramatically reduce carbon emissions. This will require action at all levels of government. In particular:
- The federal government should: finalize the Clean Power Plan to limit carbon pollution from power plants (the single largest source); secure a bold international climate agreement at the 2015 United Nations Climate Change Conference in Paris; and accelerate our transition to clean energy, including by adopting a national renewable electricity standard and measures to get America off of oil.
- State policymakers should implement the Clean Power Plan, going above and beyond individual state targets and maximizing the role of renewable energy and energy efficiency. State governments should also adopt or strengthen complementary policies, including renewable electricity and energy efficiency standards, and ensure that new state policies do not hinder the ability of regulators to comply with the Clean Power Plan. Finally, states should reduce transportation pollution through policies that reduce dependence on oil, including measures to accelerate the market for zero-emission vehicles and expand access to public transportation and other low-carbon forms of transportation.
* Based on a linear regression trend analysis of the largest annual 24-hour precipitation total from 1970 to 2011 at 3,700 weather stations across the contiguous United States. See the Methodology section for details.

