Renewables On The Rise Dashboard
America produces more than three times as much power from the sun, the wind and the earth as we did in 2013, with growth in all 50 states. Key technologies such as electric vehicles and battery storage are also booming - helping to repower America with clean energy.
The Renewables on the Rise dashboard allows you to track the growth of clean energy in your state and around the country. Explore your state’s clean energy progress, then read below for more information on the rise in renewables … and what local and state governments can do to help accelerate the transition to clean energy.
How much did America’s renewable energy and clean energy technologies grow in the last 10 years? Find out more below.
Wind power
America produced enough wind energy to power nearly 41 million typical homes in 2022 – 2.6 times as much wind energy as in 2013.
Solar power
America produced enough solar energy to power 19 million homes in 2022 – nearly 12 times as much solar energy as in 2013.
Battery storage
America had 8.9 gigawatts of battery energy storage at the end of 2022, 60 times as much as in 2013 and 85 percent more than at the end of 2021, helping to support the use of more renewable energy and keep the lights on during extreme weather and times of grid stress.
Energy efficiency
Energy efficiency improvements installed in 2021 will save 300 terawatt-hours of power over their lifetimes – enough to power 28 million homes for a year. Energy efficiency savings increased by about 20% between 2013 and 2021, the last year for which information is available.
Electric vehicles
Americans bought more than 925,000 plug-in electric vehicles in 2022 – a more than 10-fold increase from 2013. Meanwhile, the number of electric vehicle chargers nationwide exceeded 151,000 – a nearly 18-fold increase from 2013.
The Inflation Reduction Act is accelerating progress toward clean energy. Here’s how:
- Federal tax credits for renewables. The Inflation Reduction Act continues federal tax credits for wind and solar energy that have helped fuel the growth of renewable energy nationwide.
- Consumer rebates. The Inflation Reduction Act provides rebates for home efficiency upgrades and the purchase of heat pumps, electric induction stoves and other efficient electric appliances and equipment.
- Tax incentives for electric vehicles. The Inflation Reduction Act provides tax incentives to encourage the purchase of electric vehicles by individuals and businesses.
The past decade has seen exciting progress in clean energy. With continued progress and commitment, an America powered entirely by clean, renewable energy is within reach.
Making the renewable future a reality: Recommendations for state and local governments
- Set goals and make plans: Set bold goals and adopt concrete plans to transition to 100% renewable electricity, phase out dirty fossil fuel-powered cars, trucks and trains, and transition off fossil fuels in our homes and businesses.
- Use federal resources: Ensure that the clean energy incentives in the Inflation Reduction Act are fully and well implemented.
- Insist on supportive policy: Ensure that utility policies fully and fairly compensate investors in clean energy technology for the benefits they bring to society through mechanisms such as net metering for rooftop solar systems, and adopt policies for permitting and interconnection that make adoption of clean energy technologies easy and hassle-free.
- Cut energy waste: Encourage continued steady progress on energy efficiency by continuing and expanding efficiency programs and policies, including utility energy efficiency programs, building energy codes, and appliance efficiency standards.
Data sources
- Utility-scale generation of electricity, utility-scale generation of wind and geothermal energy, and estimated combined utility- and small-scale solar energy generation from 2014 onwards: U.S. Energy Information Administration’s (EIA) form EIA-923 via the EIA’s Open Data API, viewable at https://www.eia.gov/opendata/browser/electricity/electric-power-operational-data.
- Total solar energy generation prior to 2014: “Solar thermal and photovoltaic electricity total net generation (SOTGP)” data series from the EIA’s State Energy Data System via the EIA’s Open Data API, viewable at https://www.eia.gov/opendata/browser/seds.
- Total retail sales of electricity: EIA’s forms EIA-826, EIA-861 and EIA-861M via the Open Data API, viewable at https://www.eia.gov/opendata/browser/electricity/retail-sales.
- Electric vehicle sales: Registrations of electric vehicles and plug-in hybrid electric vehicles transcribed from the Alliance for Automotive Innovation’s Electric Vehicle Sales Dashboard, accessible at https://www.autosinnovate.org/resources/electric-vehicle-sales-dashboard.
- Electric vehicle chargers: U.S. Department of Energy Alternative Fuel Data Center’s Alternative Fuel Station Locator developer API, accessed at https://afdc.energy.gov/stations/#/analyze?country=US&fuel=ELEC&ev_levels=all&access=public&access=private, and only including open stations.
- Energy savings from energy efficiency programs: Based on all-sector, expected lifetime annual energy savings for 2021 from EIA’s form EIA-861 via the Open Data API, viewable at https://www.eia.gov/opendata/browser/electricity/state-electricity-profiles/energy-efficiency. These savings represent the expected savings from efficiency measures installed during 2021, and do not include savings from projects installed in previous years. The figures presented here represent savings at customer meters, not savings during generation, transmission or distribution of electricity: U.S. Energy Information Administration, Form EIA-861 Annual Electric Power Industry Report Instructions, p. 14, accessed July 31, 2023 at https://www.eia.gov/survey/form/eia_861/proposed/2023/instructions.pdf.
- Battery capacity: Based on nameplate capacity of operable generators using battery technology from December of the years analyzed, compiled from EIA’s forms EIA-860 and EIA-860M via the Open Data API, viewable at https://www.eia.gov/opendata/browser/electricity/operating-generator-capacity.
Methodology
- Data last updated September 15, 2023.
- Rankings for growth are based on total increase, not percentage or per-capita change.
- The number of EV chargers in each year was calculated as the total number of currently existing chargers for which the open date was in or before the year in question. Chargers that have closed and been removed from the U.S. Department of Energy’s database are not reflected in the totals.
- Comparisons to the number of households that could be powered by a certain amount of electricity generated or saved are based on EIA’s average annual household electricity use for the United States in 2021 of 10.632 MWh, obtained from https://web.archive.org/web/20230731183455/https://www.eia.gov/tools/faqs/faq.php?id=97&t=3.
- Calculations of solar, wind and geothermal generation as a percentage of total generation are based on the sum of utility-scale and small-scale solar, calculated by subtracting utility-scale solar generation from EIA’s reported total utility-scale generation, and then adding estimated total solar generation (which includes both utility-scale and small-scale generation). For these calculations, estimated total solar generation prior to 2014 comes from EIA’s State Energy Data System and for 2014 and beyond from form EIA-923 as described above.

Tell Walmart to go solar
To protect our communities and the future of our planet, we must move off of fossil fuels, and businesses have a big role to play in that transition.
Topics
Authors
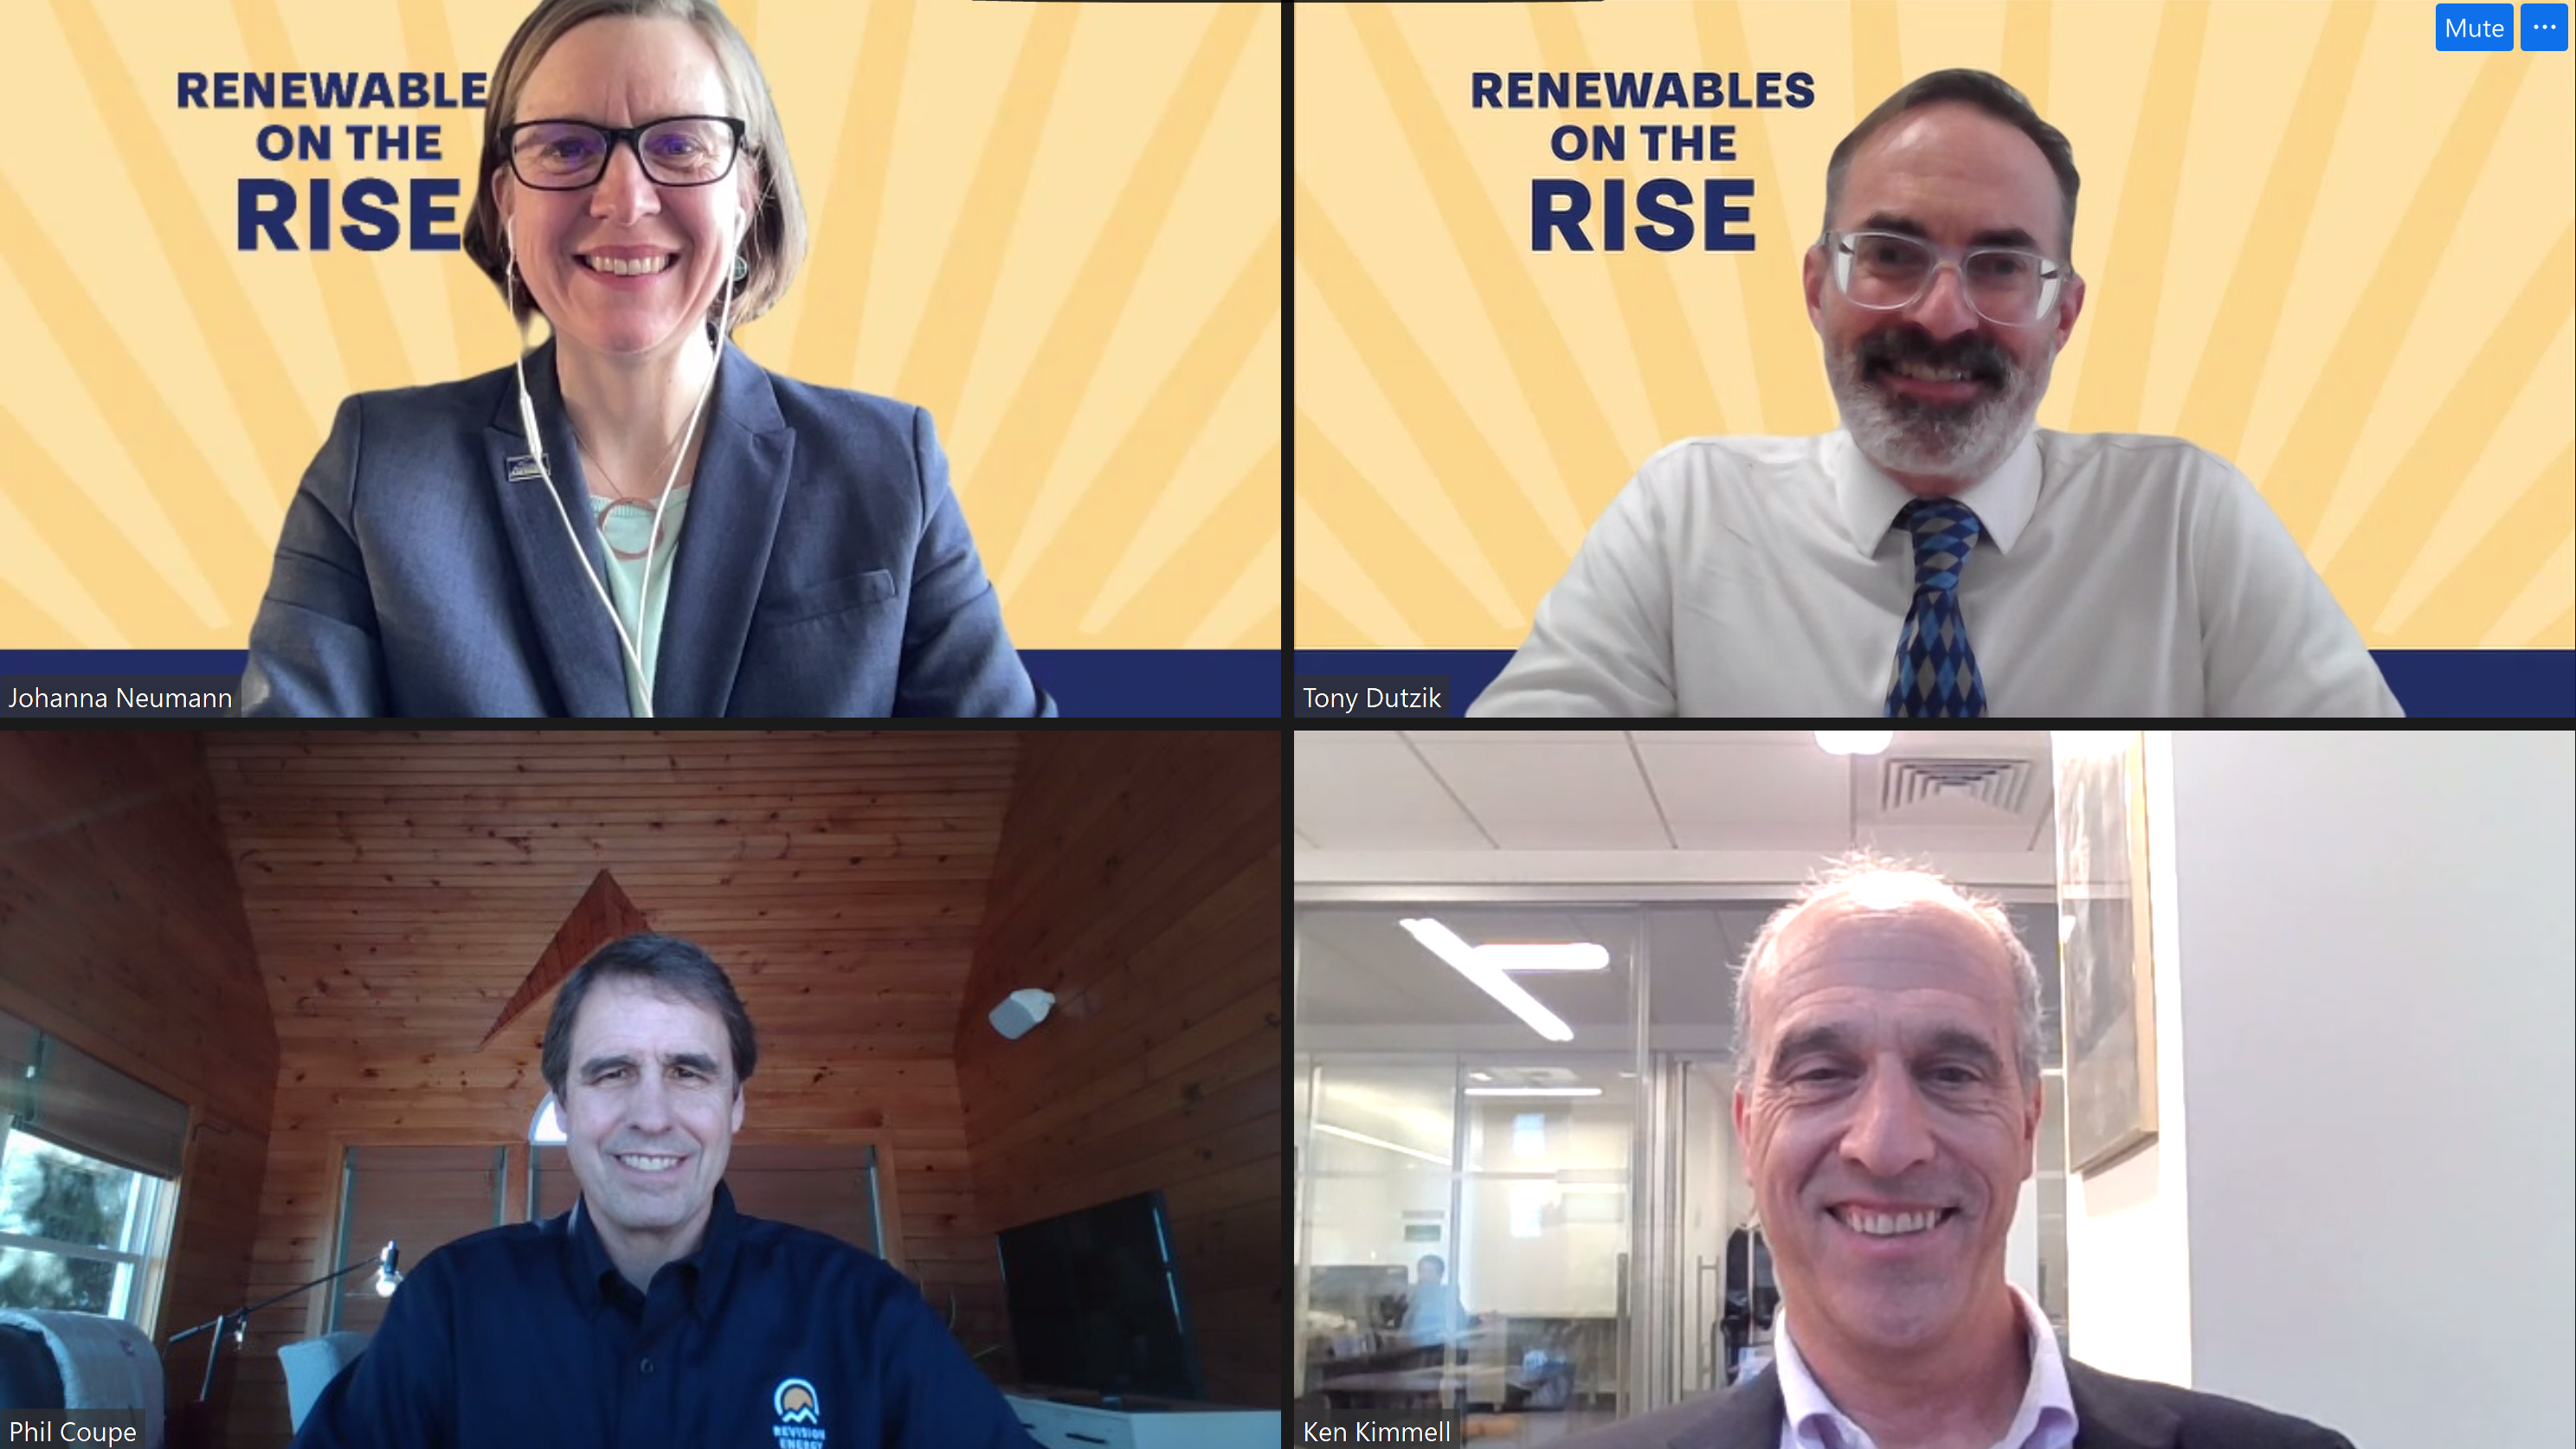
Johanna Neumann
Senior Director, Campaign for 100% Renewable Energy, Environment America Research & Policy Center
Johanna directs strategy and staff for Environment America's energy campaigns at the local, state and national level. In her prior positions, she led the campaign to ban smoking in all Maryland workplaces, helped stop the construction of a new nuclear reactor on the shores of the Chesapeake Bay and helped build the support necessary to pass the EmPOWER Maryland Act, which set a goal of reducing the state’s per capita electricity use by 15 percent. She also currently serves on the board of Community Action Works. Johanna lives in Amherst, Massachusetts, with her family, where she enjoys growing dahlias, biking and the occasional game of goaltimate.
Tony Dutzik
Associate Director and Senior Policy Analyst, Frontier Group
Tony Dutzik is associate director and senior policy analyst with Frontier Group. His research and ideas on climate, energy and transportation policy have helped shape public policy debates across the U.S., and have earned coverage in media outlets from the New York Times to National Public Radio. A former journalist, Tony lives and works in Boston.
Find Out More

Solar panels: How federal tax credits can help you pay for them

Recording of Rooftop Solar on the Rise webinar

Rooftop solar on the rise


