Lead in Bergen County School Drinking Water Analysis
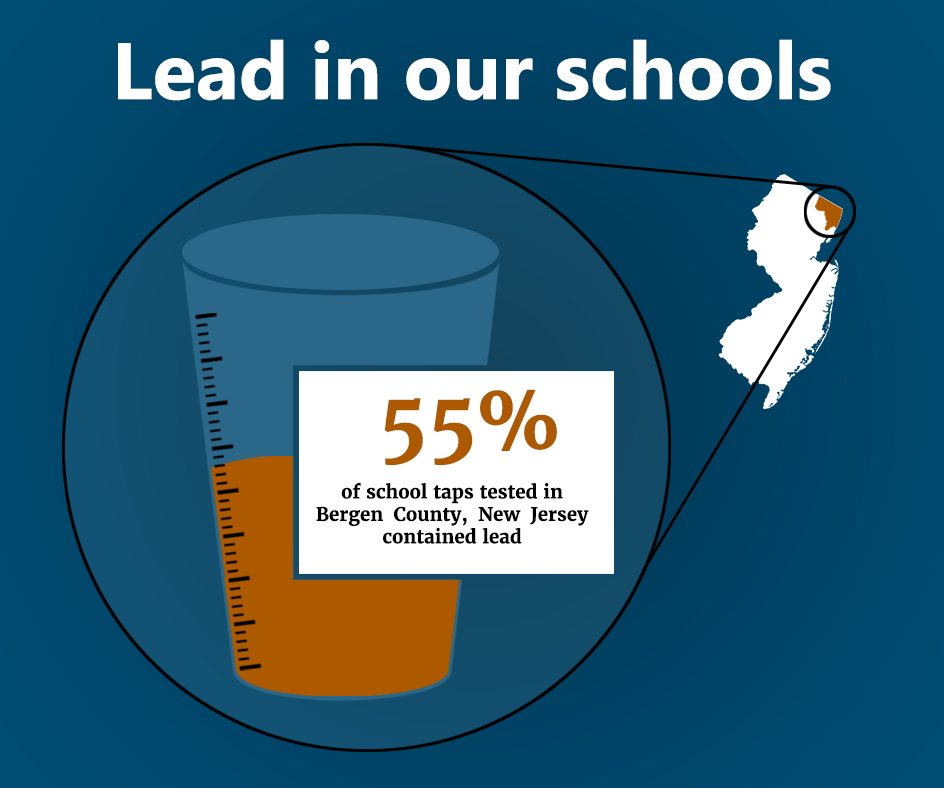
In Bergen County, the state's most populous county which includes more than 70 school districts, Environment New Jersey was able to compile complete testing results from more than 3,300 drinking water outlets from 47 districts. The results, which are required to be accessible to the public, showed that 55% of the drinking water outlets in these schools showed some level of lead contamination.

Environment New Jersey Research & Policy Center
In Bergen County, the state’s most populous county which includes more than 70 school districts, Environment New Jersey was able to compile complete testing results from more than 3,300 drinking water outlets from 47 districts. The results, which are required to be accessible to the public, showed that 55% of the drinking water outlets in these schools showed some level of lead contamination.
The following represents our methodology in researching the presence of lead in drinking water in Bergen County schools:
- We visited each school district’s website, and searched for lead in drinking water tests results. Some districts had the results posted clearly and centrally on their homepage. Some results were under Buildings and Grounds. Some required searching each individual school’s website. Some required utilizing a search bar.
- After locating results, we tallied the total number of outlets tested, as well as the number of outlets testing at or above 1 ppb (parts per billion).
- When multiple phases of testing were posted, we used the data set that provided the broadest number of outlets, rather than post-remedial testing. Our goal was to capture the total number of outlets tested, and to record outlets testing over 1 ppb.
- When first draw and flush sampling methods were used, we recorded an outlet as testing over 1ppb IF it tested for lead through EITHER process – but we did not count the outlet twice if it tested higher than 1 ppb for both first draw and flush testing.
- Where results could not be found, we called the business or administrative offices of school districts. Often, this involved leaving messages due to summer hours over the course of a month. Some messages never received a response.
- Some schools had yet to post data as of July 10, 2017.
- Each district used different testing facilities, different testing methodologies, and posted the information in different places. We attempted to compile the most complete data we could find.
- Note the tabulation was for both the number of outlets that recorded lead from 1 ppb to 15 ppb as well as exceedances at and above 15 ppb. In some circumstances, the number of positive lead results exceeded the total number of drinking water outlets based on this calculation.
- In the end, we were able to find complete data on testing for all outlets for lead from 47 out of 72 districts.
- For 10 districts, only information regarding outlets exceeding the 15 ppb standard was found. Results only showing outlets testing over 15 ppb were not recorded.
- 6 districts had not yet completed and/or posted their data on their websites as of last week.
- 9 districts did not have readily available data, and could not be reached to confirm the status of their testing despite messages left.
Topics
Find Out More


Safe for Swimming?

The Threat of “Forever Chemicals”

