Safe for swimming?
Pollution at our beaches and how to prevent it
Downloads
Gideon Weissman
Former Policy Analyst, Frontier Group
The 2021 edition of a report by Environment America Research & Policy Center and Frontier Group
Americans love clean water. Every year, millions of us flock to our waterways to swim, surf, or go tubing, kayaking or fishing. That’s why the federal Clean Water Act set a goal of making all our waterways safe for swimming. Yet our research finds that all too often our beaches are still plagued with pollution, and millions of swimmers get sick every year. To dramatically reduce this pollution, we must boldy invest in improving our water infrastructure.
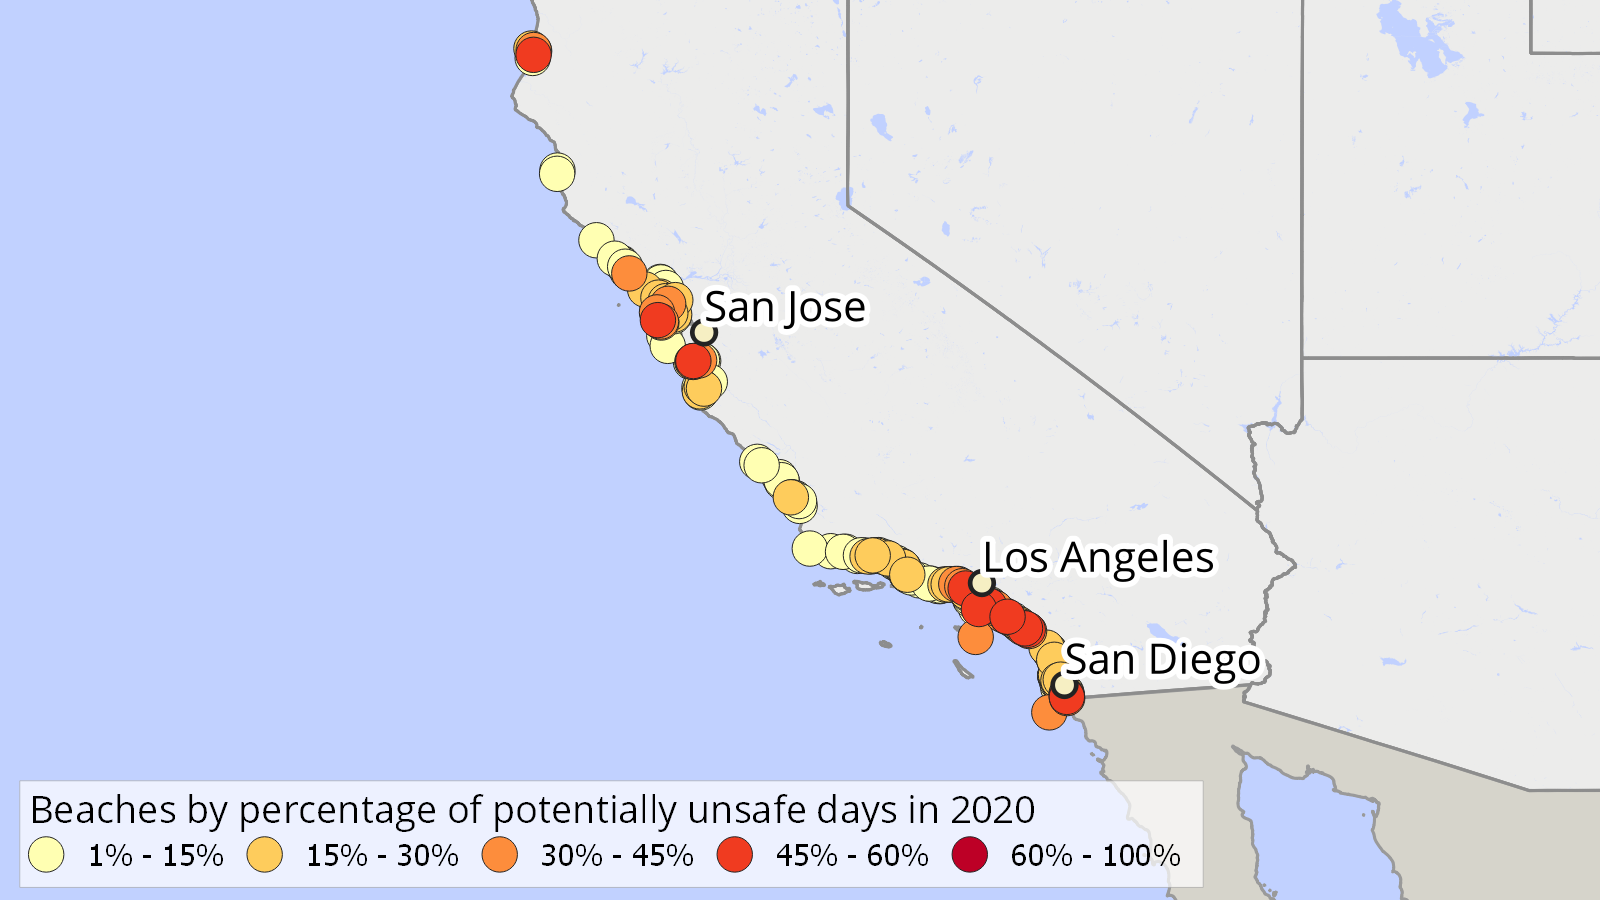
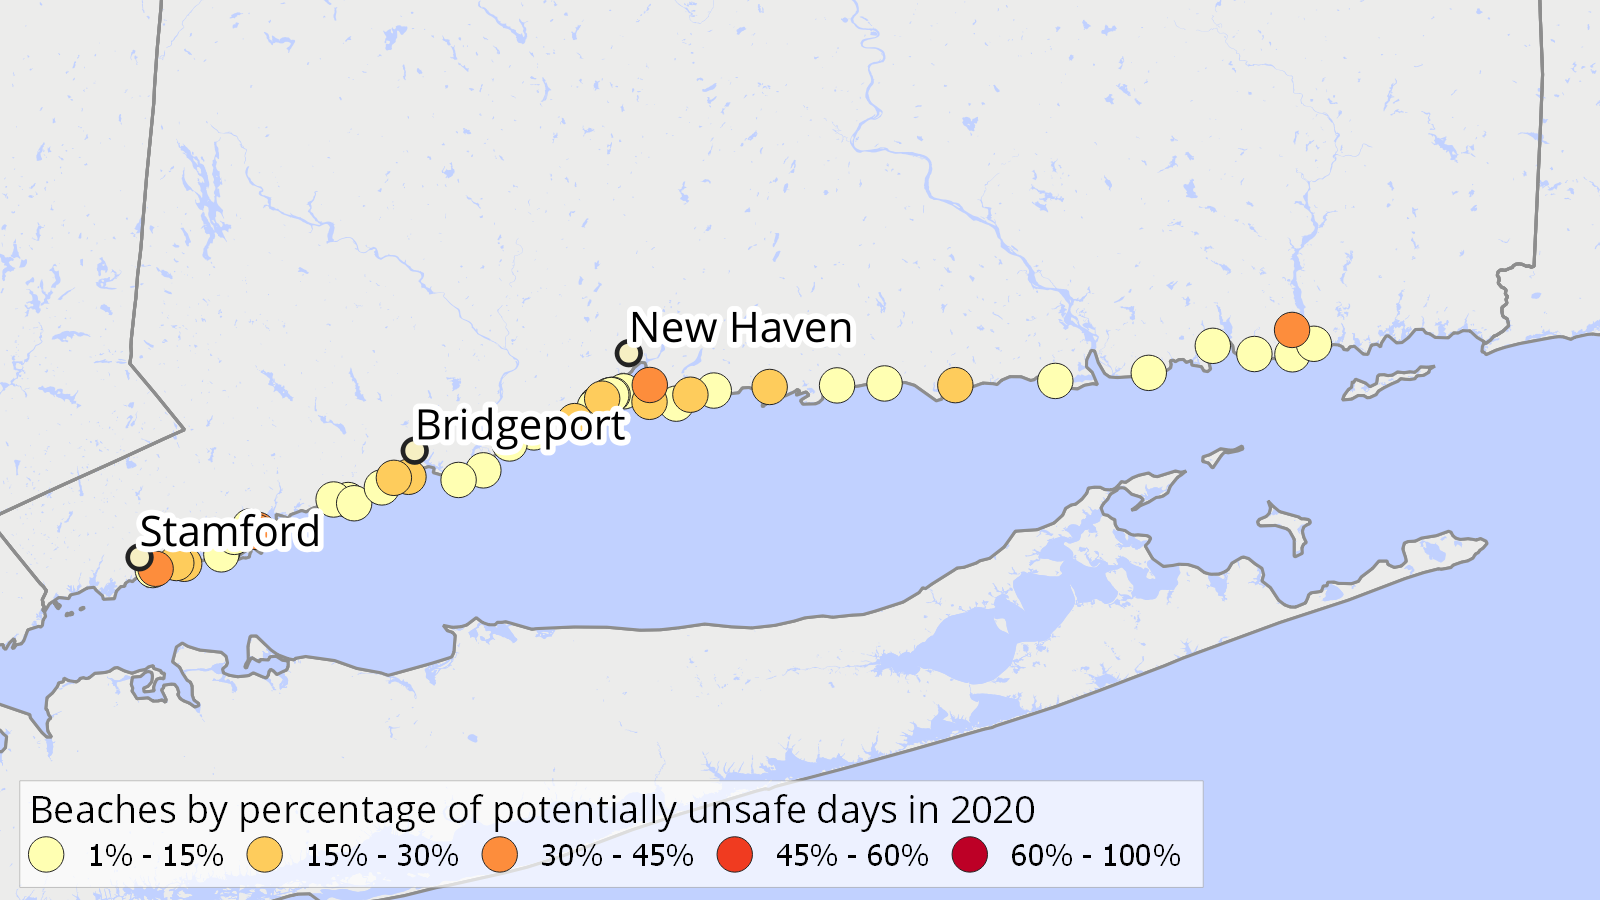
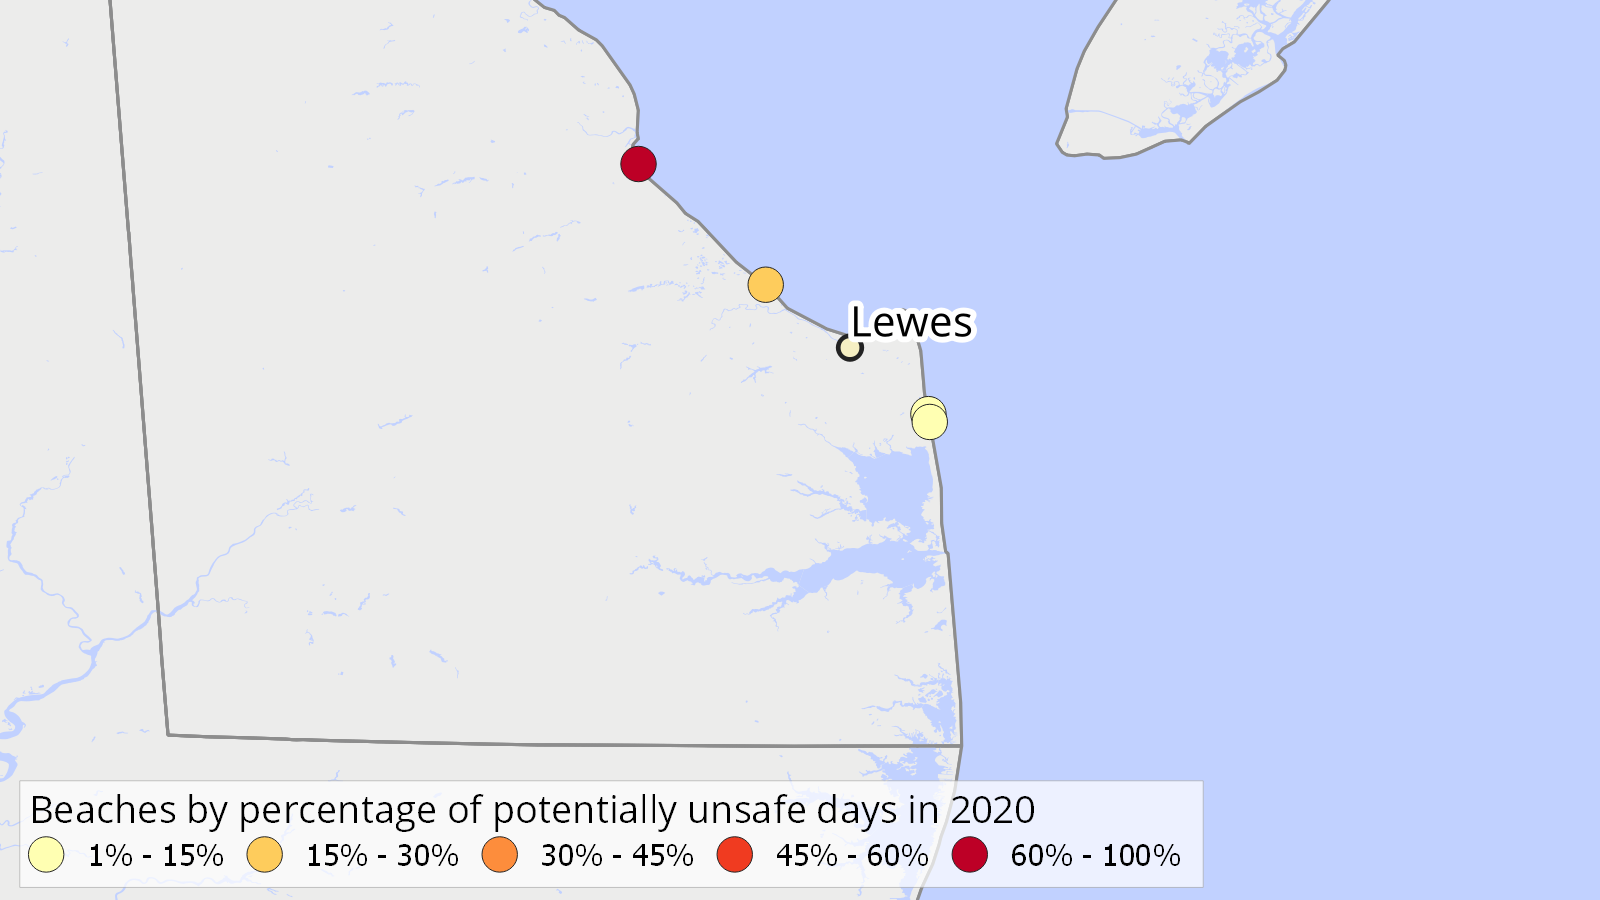
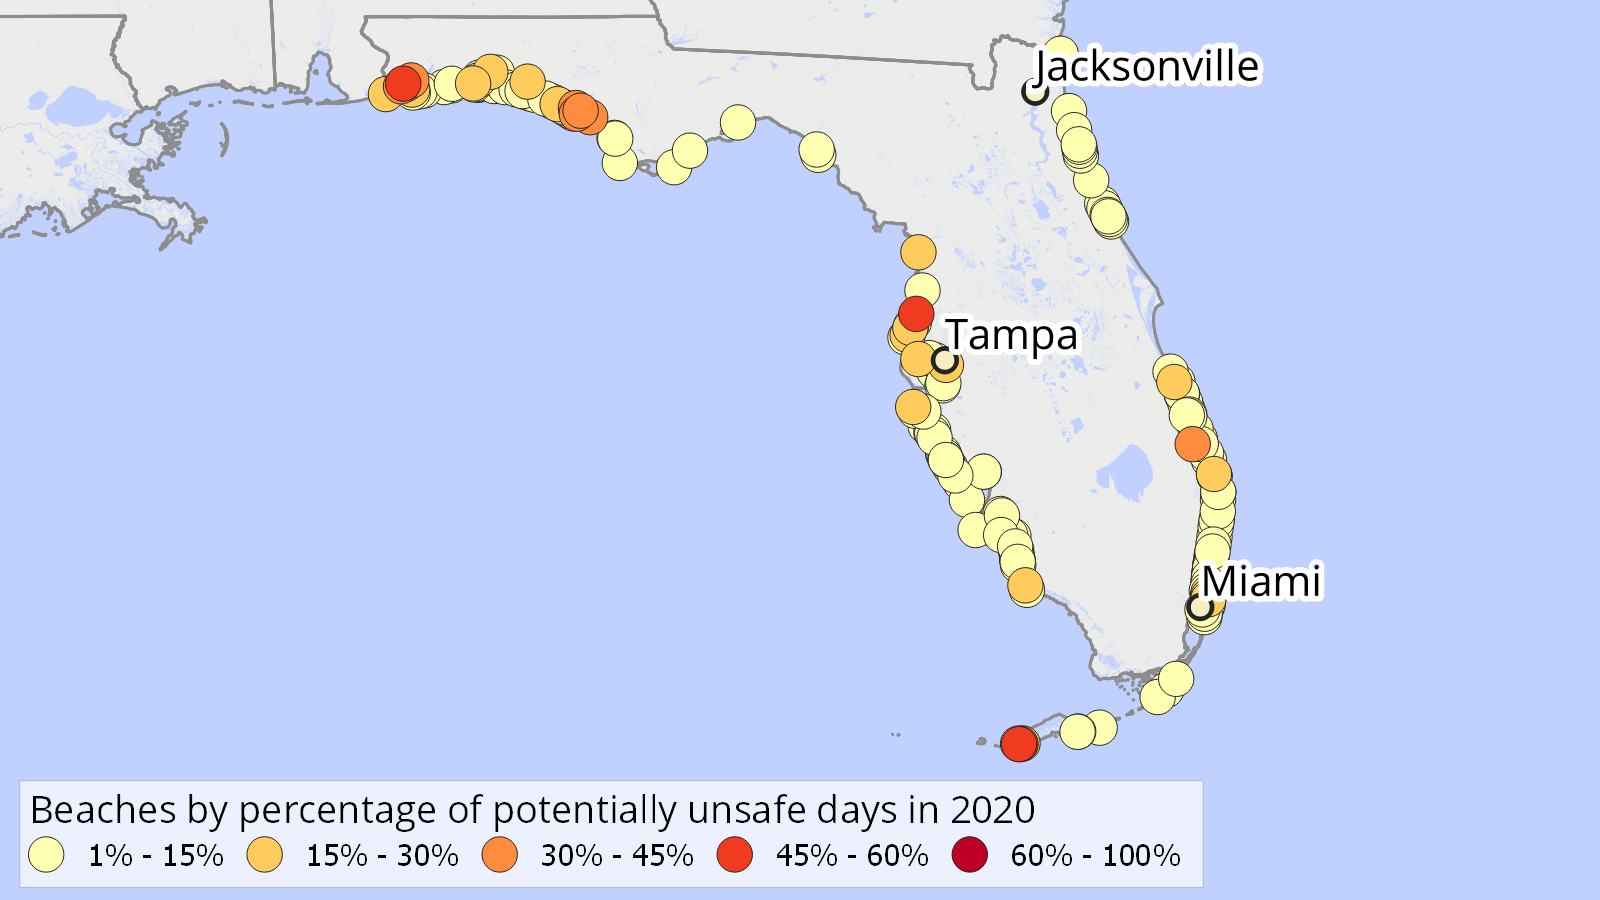
Table shows beaches with most potentially unsafe days in 2020.
Use the dropdown below to see which beaches in were potentially unsafe for swimming on the most days last year.
Use the dropdown below to see which beaches in were potentially unsafe for swimming on the most days last year.
| Beach name | County | Potentially unsafe days in 2020 | Days with testing | Percentage of testing days with potentially unsafe water |
|---|---|---|---|---|
| Spanish Cove | Baldwin County | 14 | 37 | 38% |
| Orange Beach Waterfront Park | Baldwin County | 12 | 38 | 32% |
| Mary Ann Nelson Beach | Baldwin County | 10 | 24 | 42% |
| May Day Park | Baldwin County | 10 | 32 | 31% |
| Fowl River at Highway 193 | Mobile County | 10 | 33 | 30% |
| Dog River at Alba Club | Mobile County | 9 | 34 | 26% |
| Kee Avenue | Baldwin County | 9 | 35 | 26% |
| Volanta Avenue | Baldwin County | 6 | 31 | 19% |
| Camp Beckwith | Baldwin County | 6 | 52 | 12% |
| Pirate's Cove | Baldwin County | 5 | 32 | 16% |
| Beach name | County | Potentially unsafe days in 2020 | Days with testing | Percentage of testing days with potentially unsafe water |
|---|---|---|---|---|
| Marina Del Rey at Mother's Beach*† | Los Angeles County | 165 | 307 | 54% |
| Inner Cabrillo Beach*† | Los Angeles County | 141 | 253 | 56% |
| Santa Monica State Beach*† | Los Angeles County | 120 | 299 | 40% |
| Imperial Beach*† | San Diego County | 102 | 221 | 46% |
| Tijuana Slough National Wildlife Refuge*† | San Diego County | 101 | 179 | 56% |
| Topanga State Beach† | Los Angeles County | 93 | 255 | 36% |
| Border Field State Park*† | San Diego County | 78 | 178 | 44% |
| Long Beach* | Los Angeles County | 77 | 148 | 52% |
| North Imperial Beach† | San Diego County | 58 | 205 | 28% |
| Imperial Beach Pier Area† | San Diego County | 54 | 162 | 33% |
* Beach has more than one associated testing site, which may affect number of potentially unsafe days.
† Some beach water quality tests assessed E. coli for marine water, for which no Beach Action Value is available. Those tests were not considered in calculating potentially unsafe days.
| Beach name | County | Potentially unsafe days in 2020 | Days with testing | Percentage of testing days with potentially unsafe water |
|---|---|---|---|---|
| Calf Pasture Beach* | Fairfield County | 7 | 18 | 39% |
| Fort Hale Park Beach* | New Haven County | 7 | 20 | 35% |
| Cummings Beach* | Fairfield County | 6 | 15 | 40% |
| Green Harbor Beach | New London County | 6 | 16 | 38% |
| Shady Beach* | Fairfield County | 5 | 15 | 33% |
| Lighthouse Point Beach* | New Haven County | 5 | 20 | 25% |
| Seabright Beach | Fairfield County | 4 | 14 | 29% |
| Seaside Park Beach* | Fairfield County | 4 | 14 | 29% |
| Pear Tree Point Beach* | Fairfield County | 4 | 15 | 27% |
| Weed Beach* | Fairfield County | 4 | 15 | 27% |
* Beach has more than one associated testing site, which may affect number of potentially unsafe days.
| Beach name | County | Potentially unsafe days in 2020 | Days with testing | Percentage of testing days with potentially unsafe water |
|---|---|---|---|---|
| Slaughter Beach | Sussex County | 10 | 16 | 62% |
| Broadkill Beach | Sussex County | 3 | 16 | 19% |
| Rehoboth Beach at Rehoboth Ave. | Sussex County | 2 | 30 | 7% |
| Rehoboth Beach at Virginia Ave | Sussex County | 1 | 16 | 6% |
| Beach name | County | Potentially unsafe days in 2020 | Days with testing | Percentage of testing days with potentially unsafe water |
|---|---|---|---|---|
| South Beach | Monroe County | 19 | 33 | 58% |
| Higgs Beach | Monroe County | 17 | 35 | 49% |
| Roosevelt Bridge | Martin County | 17 | 53 | 32% |
| Bayou Texar | Escambia County | 16 | 46 | 35% |
| Bayou Chico | Escambia County | 15 | 29 | 52% |
| Beach Drive | Bay County | 15 | 35 | 43% |
| Delwood Beach | Bay County | 15 | 35 | 43% |
| Carl Gray Park | Bay County | 14 | 35 | 40% |
| Miami Beach by 53rd St. | Miami-Dade County | 14 | 58 | 24% |
| Dupont Bridge | Bay County | 13 | 35 | 37% |
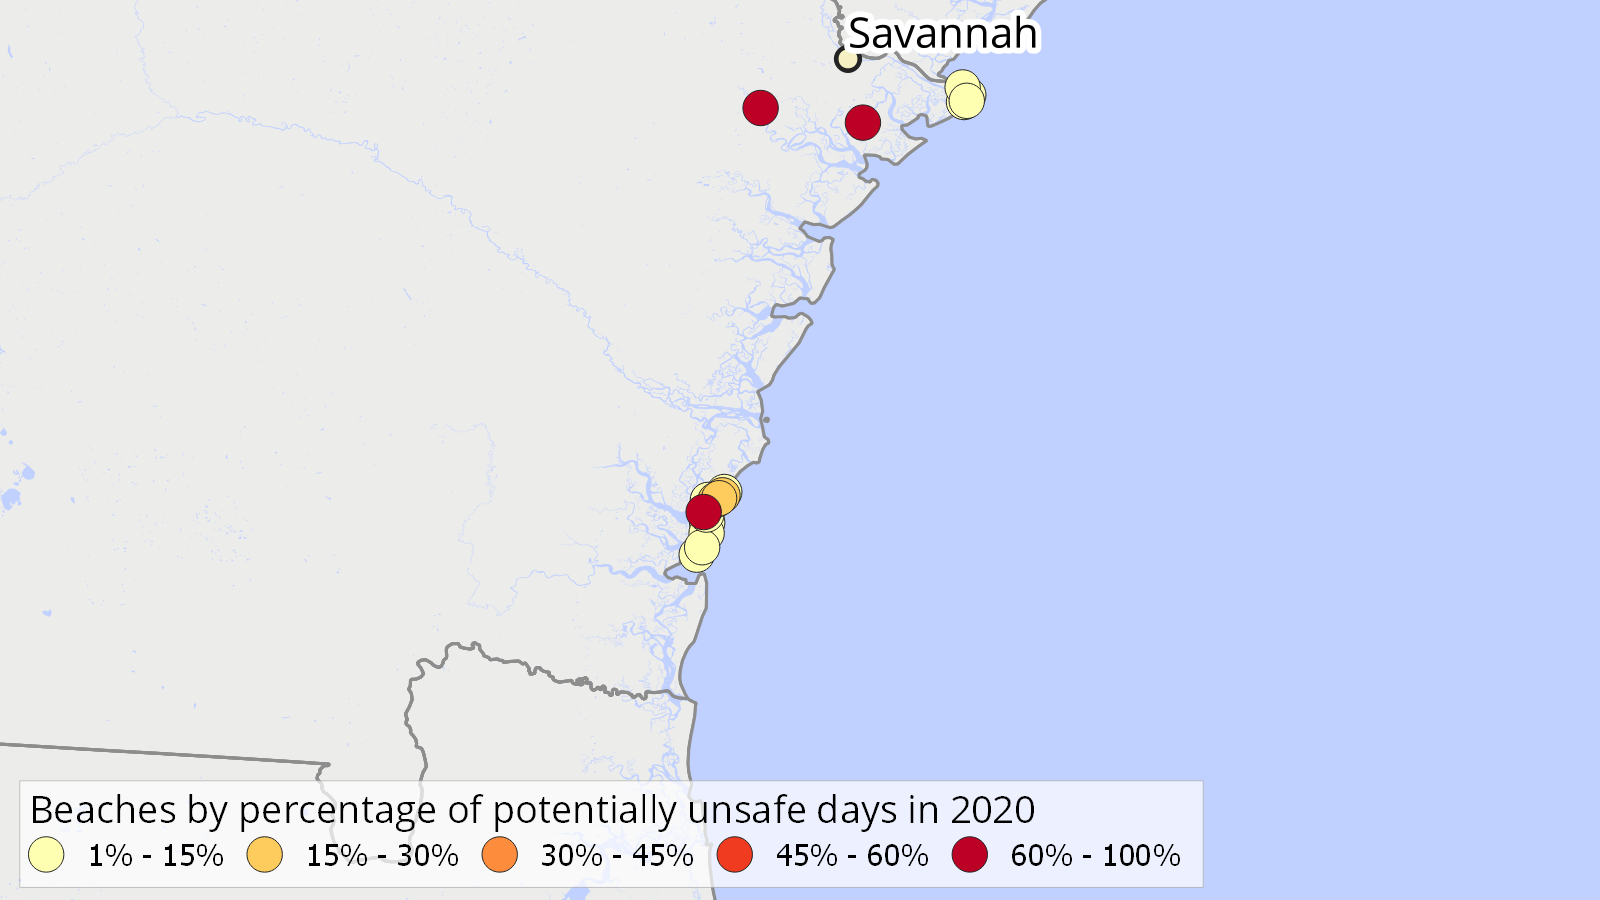
| Beach name | County | Potentially unsafe days in 2020 | Days with testing | Percentage of testing days with potentially unsafe water |
|---|---|---|---|---|
| Massengale Park | Glynn County | 12 | 49 | 24% |
| East Beach | Glynn County | 7 | 44 | 16% |
| 5th St. Crossover | Glynn County | 7 | 46 | 15% |
| Jekyll Driftwood Beach | Glynn County | 6 | 45 | 13% |
| St. Simons Island Lighthouse | Glynn County | 6 | 45 | 13% |
| Tybee Island by Strand Ave. | Chatham County | 5 | 43 | 12% |
| Skidaway Narrows | Chatham County | 4 | 6 | 67% |
| Jekyll Island at South Dunes | Glynn County | 4 | 41 | 10% |
| Tybee Island by Polk St. | Chatham County | 4 | 43 | 9% |
| St. Simons Island by 12th St. | Glynn County | 4 | 44 | 9% |
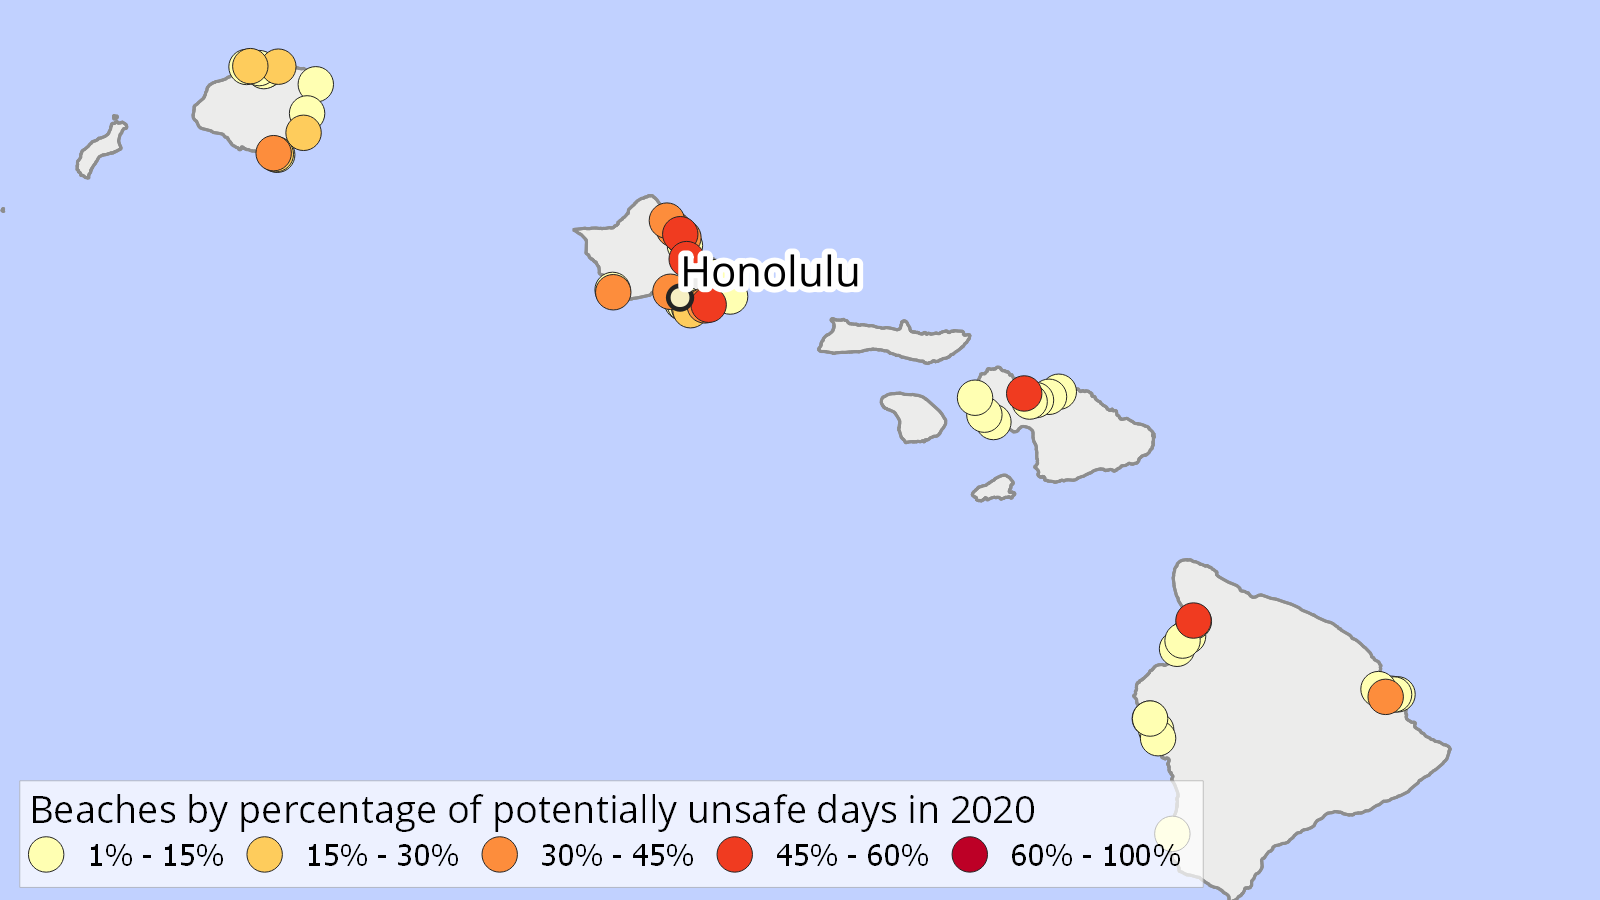
| Beach name | County | Potentially unsafe days in 2020 | Days with testing | Percentage of testing days with potentially unsafe water |
|---|---|---|---|---|
| Kalapaki Beach | Kauai County | 10 | 44 | 23% |
| Ke'e Beach | Kauai County | 4 | 38 | 11% |
| Kahanamoku Beach* | Honolulu County | 4 | 48 | 8% |
| Laenani Park | Honolulu County | 3 | 5 | 60% |
| Kawaiku'i Beach Park | Honolulu County | 3 | 6 | 50% |
| Hanakao'o Park | Maui County | 3 | 27 | 11% |
| Lydgate State Park | Kauai County | 3 | 34 | 9% |
| Royal-Moana Beach | Honolulu County | 3 | 44 | 7% |
| Kailua Bay* | Hawaii County | 3 | 58 | 5% |
| Ice Pond | Hawaii County | 2 | 5 | 40% |
| Koloa Landing | Kauai County | 2 | 5 | 40% |
* Beach has more than one associated testing site, which may affect number of potentially unsafe days.
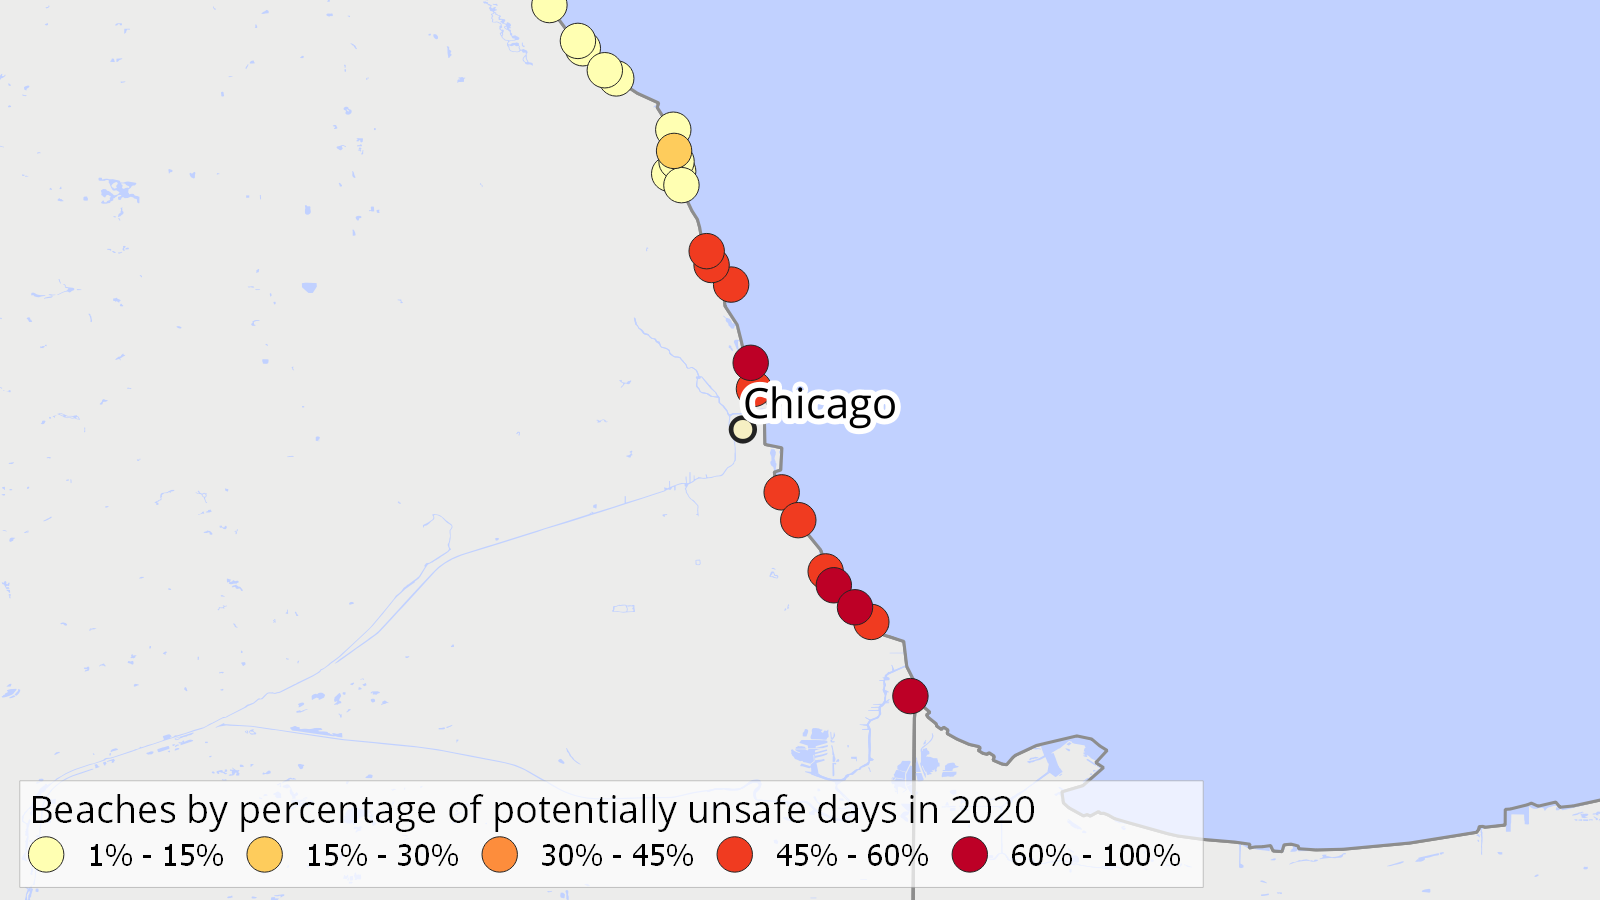
| Beach name | County | Potentially unsafe days in 2020 | Days with testing | Percentage of testing days with potentially unsafe water |
|---|---|---|---|---|
| Evanston Clark Beach | Cook County | 16 | 88 | 18% |
| Glencoe Park Beach | Cook County | 12 | 97 | 12% |
| North Point Marina Beach | Lake County | 11 | 58 | 19% |
| Waukegan South Beach | Lake County | 6 | 58 | 10% |
| Evanston South Beach | Cook County | 6 | 88 | 7% |
| Evanston Greenwood Beach | Cook County | 5 | 84 | 6% |
| Northwestern University Beach | Cook County | 5 | 88 | 6% |
| Highland Park Rosewood Beach | Lake County | 5 | 91 | 5% |
| Winnetka Tower Beach | Cook County | 5 | 92 | 5% |
| Illinois Beach State Park - South Beach | Lake County | 4 | 50 | 8% |
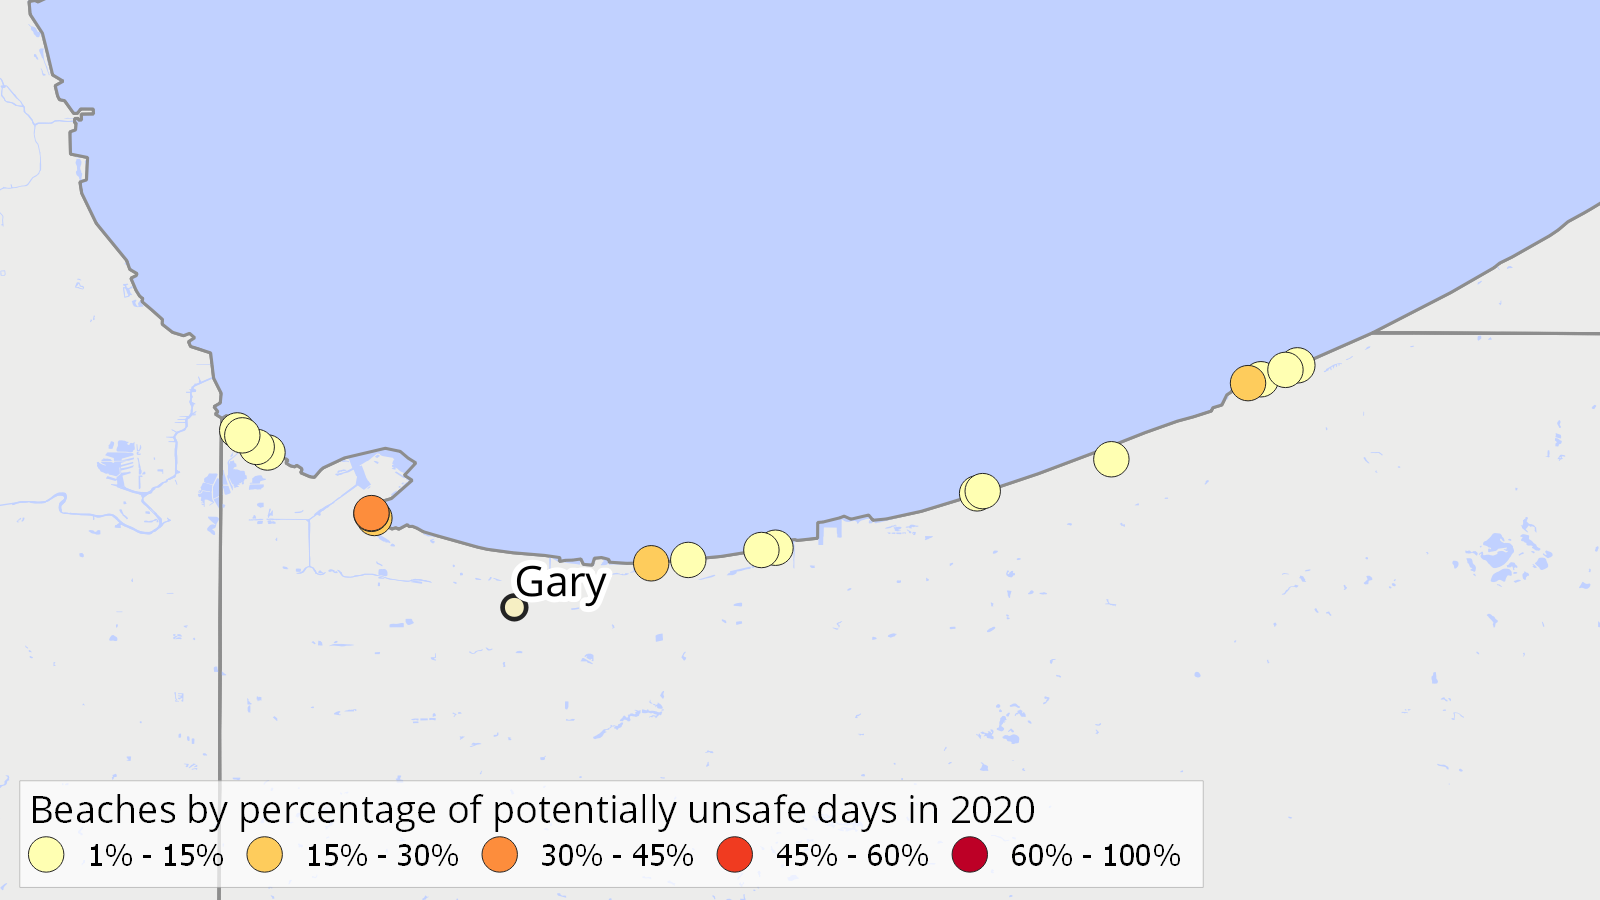
| Beach name | County | Potentially unsafe days in 2020 | Days with testing | Percentage of testing days with potentially unsafe water |
|---|---|---|---|---|
| Jeorse Park Beach I | Lake County | 27 | 84 | 32% |
| Washington Park Beach | LaPorte County | 25 | 114 | 22% |
| Jeorse Park Beach II | Lake County | 19 | 84 | 23% |
| Buffington Harbor Beach | Lake County | 18 | 84 | 21% |
| Indiana Dunes State Park East Beach | Porter County | 12 | 106 | 11% |
| Hammond Marina East Beach | Lake County | 12 | 107 | 11% |
| Whihala Beach West | Lake County | 11 | 109 | 10% |
| Indiana Dunes State Park West Beach | Porter County | 10 | 104 | 10% |
| Lake Street Beach | Lake County | 8 | 48 | 17% |
| Ogden Dunes West Beach | Porter County | 6 | 105 | 6% |
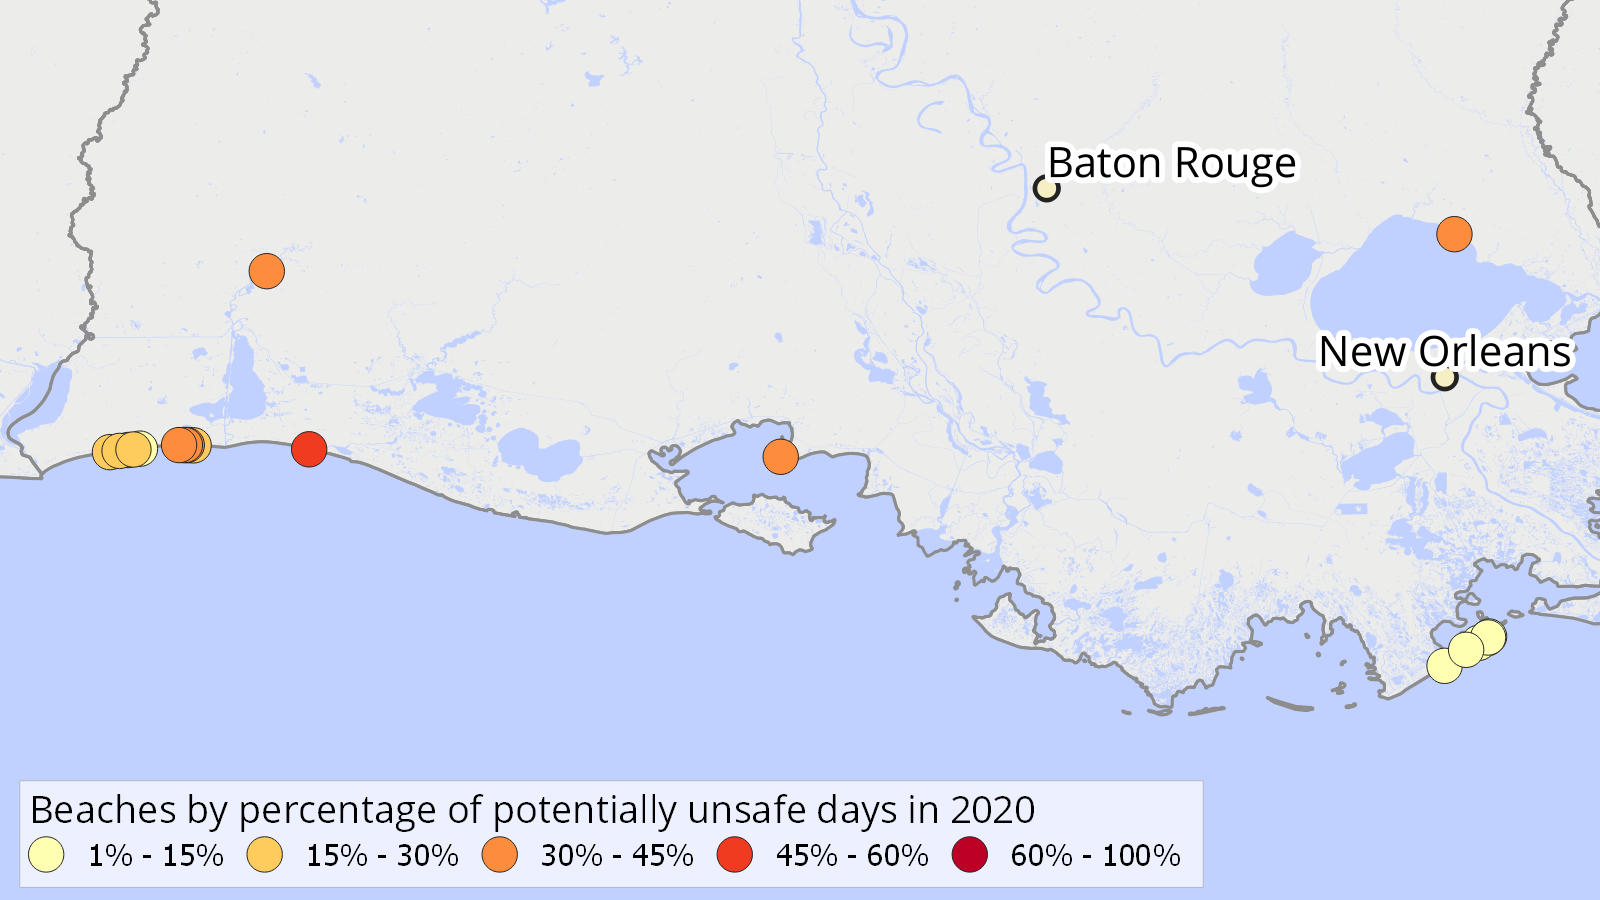
| Beach name | Parish | Potentially unsafe days in 2020 | Days with testing | Percentage of testing days with potentially unsafe water |
|---|---|---|---|---|
| Rutherford Beach | Cameron Parish | 12 | 26 | 46% |
| Cypremort Point Beach | St. Mary Parish | 12 | 28 | 43% |
| Fontainebleau Beach | St. Tammany Parish | 11 | 26 | 42% |
| Lake Charles North Beach | Calcasieu Parish | 10 | 27 | 37% |
| Holly Beach - Site 6 | Cameron Parish | 9 | 21 | 43% |
| Holly Beach - Site 3 | Cameron Parish | 7 | 21 | 33% |
| Holly Beach - Site 4 | Cameron Parish | 7 | 21 | 33% |
| Gulf Breeze Beach | Cameron Parish | 6 | 21 | 29% |
| Holly Beach - Site 1 | Cameron Parish | 6 | 21 | 29% |
| Holly Beach - Site 5 | Cameron Parish | 6 | 21 | 29% |
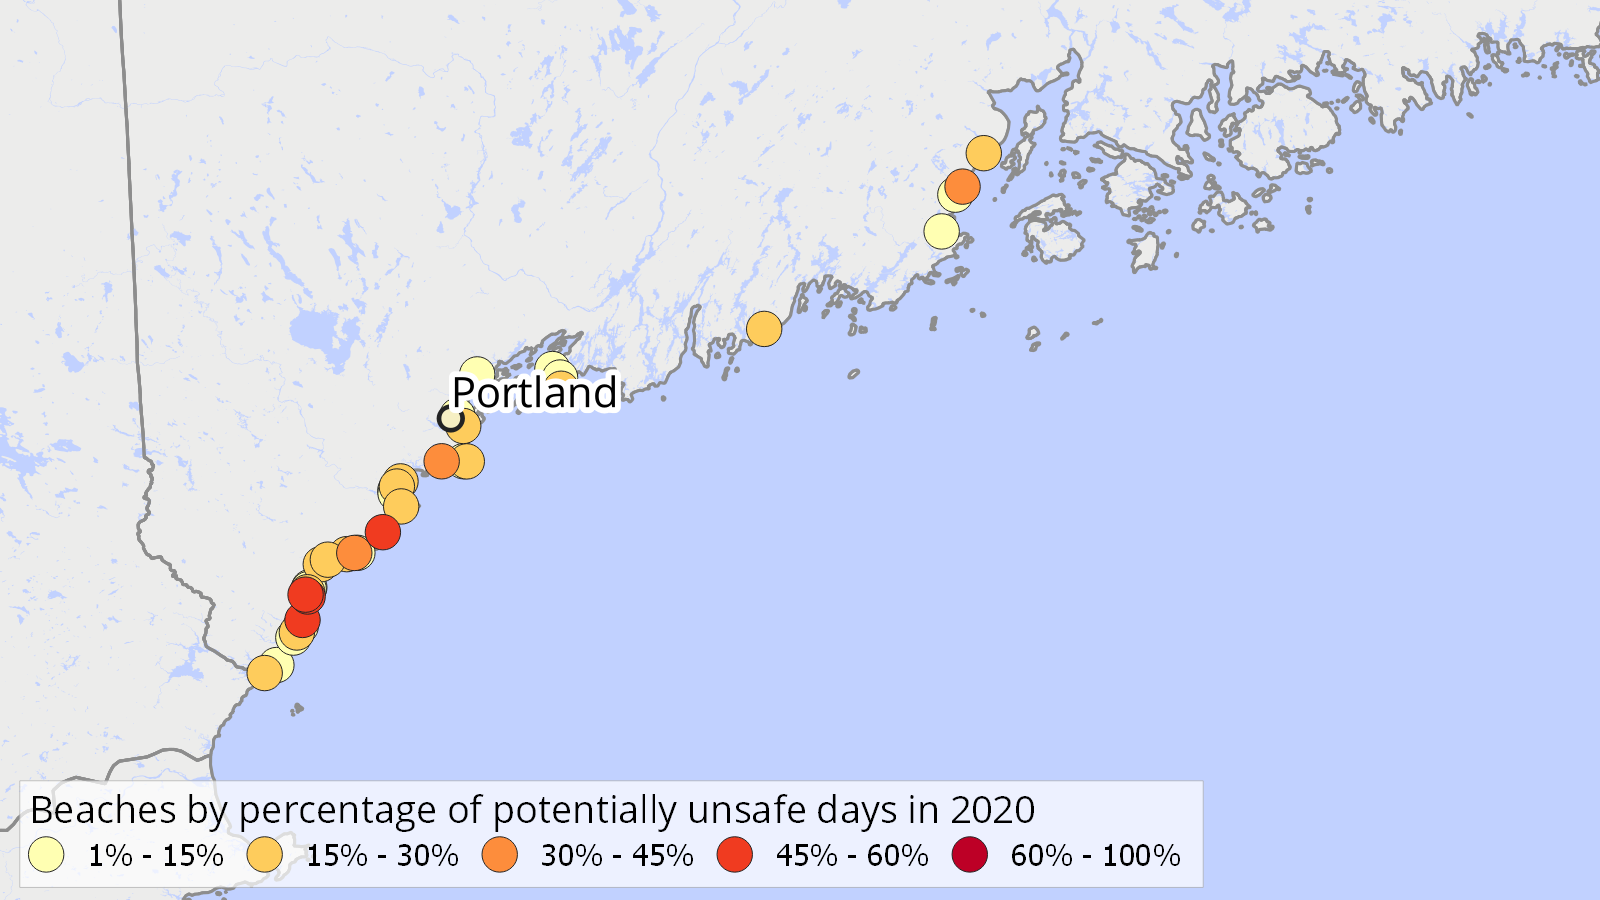
| Beach name | County | Potentially unsafe days in 2020 | Days with testing | Percentage of testing days with potentially unsafe water |
|---|---|---|---|---|
| Goose Rocks* | York County | 14 | 26 | 54% |
| Riverside (Ogunquit) | York County | 10 | 19 | 53% |
| Little Beach | York County | 8 | 17 | 47% |
| Willard Beach | Cumberland County | 7 | 24 | 29% |
| Cape Neddick Beach | York County | 6 | 13 | 46% |
| Laite Beach | Knox County | 6 | 17 | 35% |
| Gooch's Beach* | York County | 5 | 15 | 33% |
| Lincolnville Beach | Waldo County | 5 | 18 | 28% |
| Higgins Beach* | Cumberland County | 4 | 13 | 31% |
| Ogunquit Beach | York County | 4 | 14 | 29% |
* Beach has more than one associated testing site, which may affect number of potentially unsafe days.
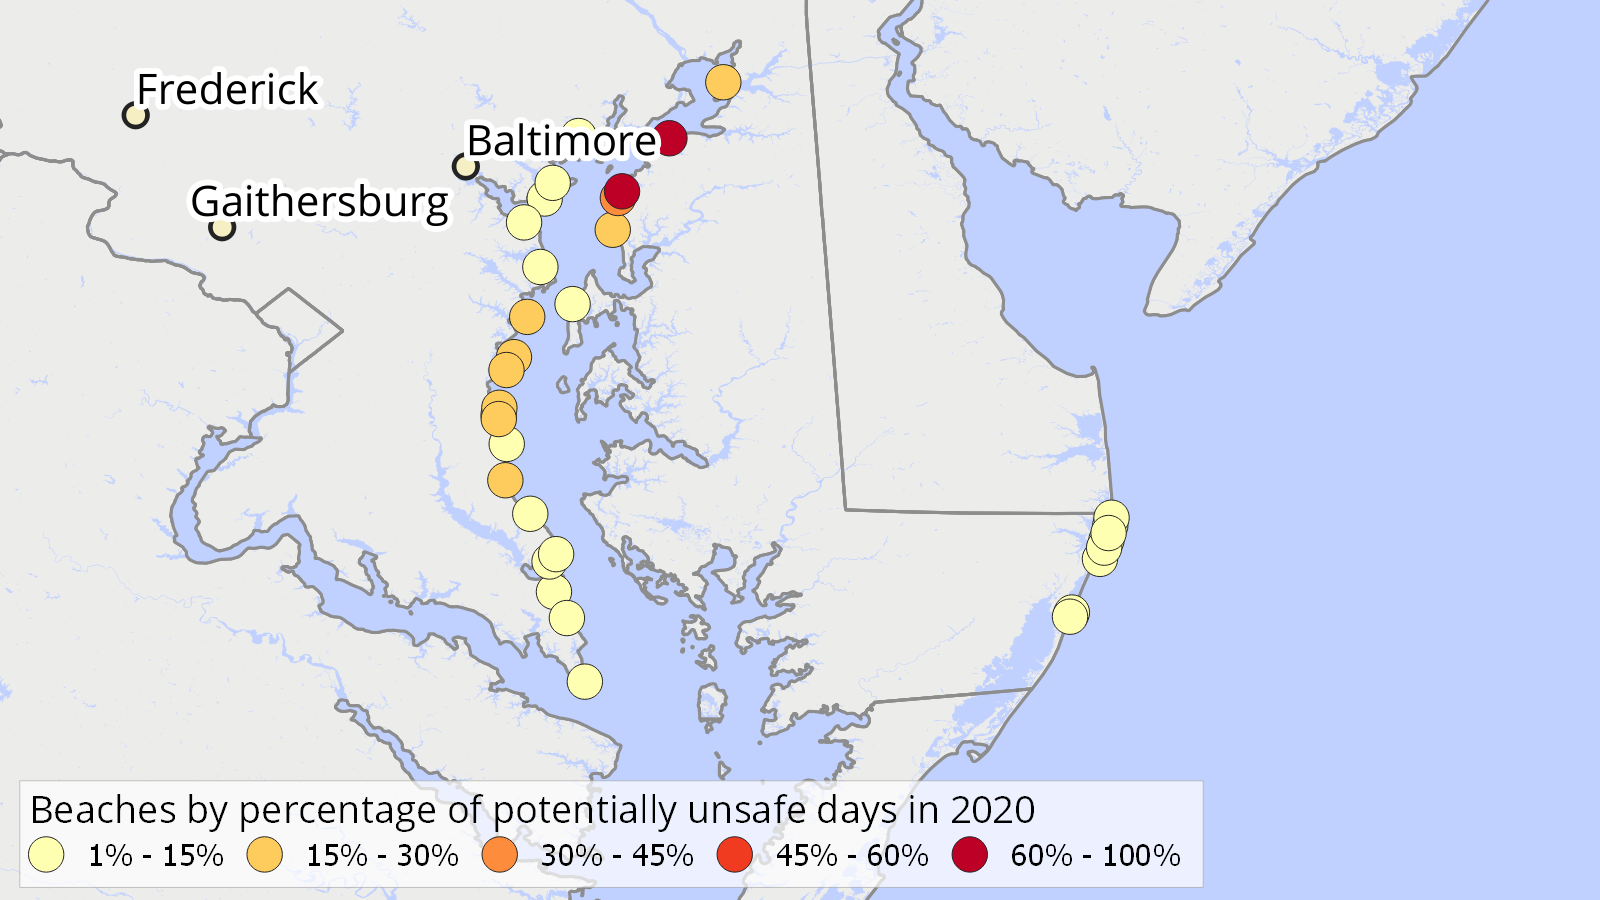
| Beach name | County | Potentially unsafe days in 2020 | Days with testing | Percentage of testing days with potentially unsafe water |
|---|---|---|---|---|
| Tolchester Estates Beach | Kent County | 5 | 8 | 62% |
| Brownie's Beach | Calvert County | 5 | 18 | 28% |
| North East Beach at Elk Neck State Park | Cecil County | 4 | 14 | 29% |
| North Beach | Calvert County | 4 | 17 | 24% |
| Ocean City Beach 4 | Worcester County | 3 | 35 | 9% |
| Tolchester Marina and Beach | Kent County | 2 | 6 | 33% |
| Scientists Cliffs | Calvert County | 2 | 7 | 29% |
| Oceanside Beach Site 3 | Worcester County | 2 | 15 | 13% |
| Breezy Point | Calvert County | 2 | 16 | 12% |
| Elm's Beach | St. Mary's County | 2 | 16 | 12% |
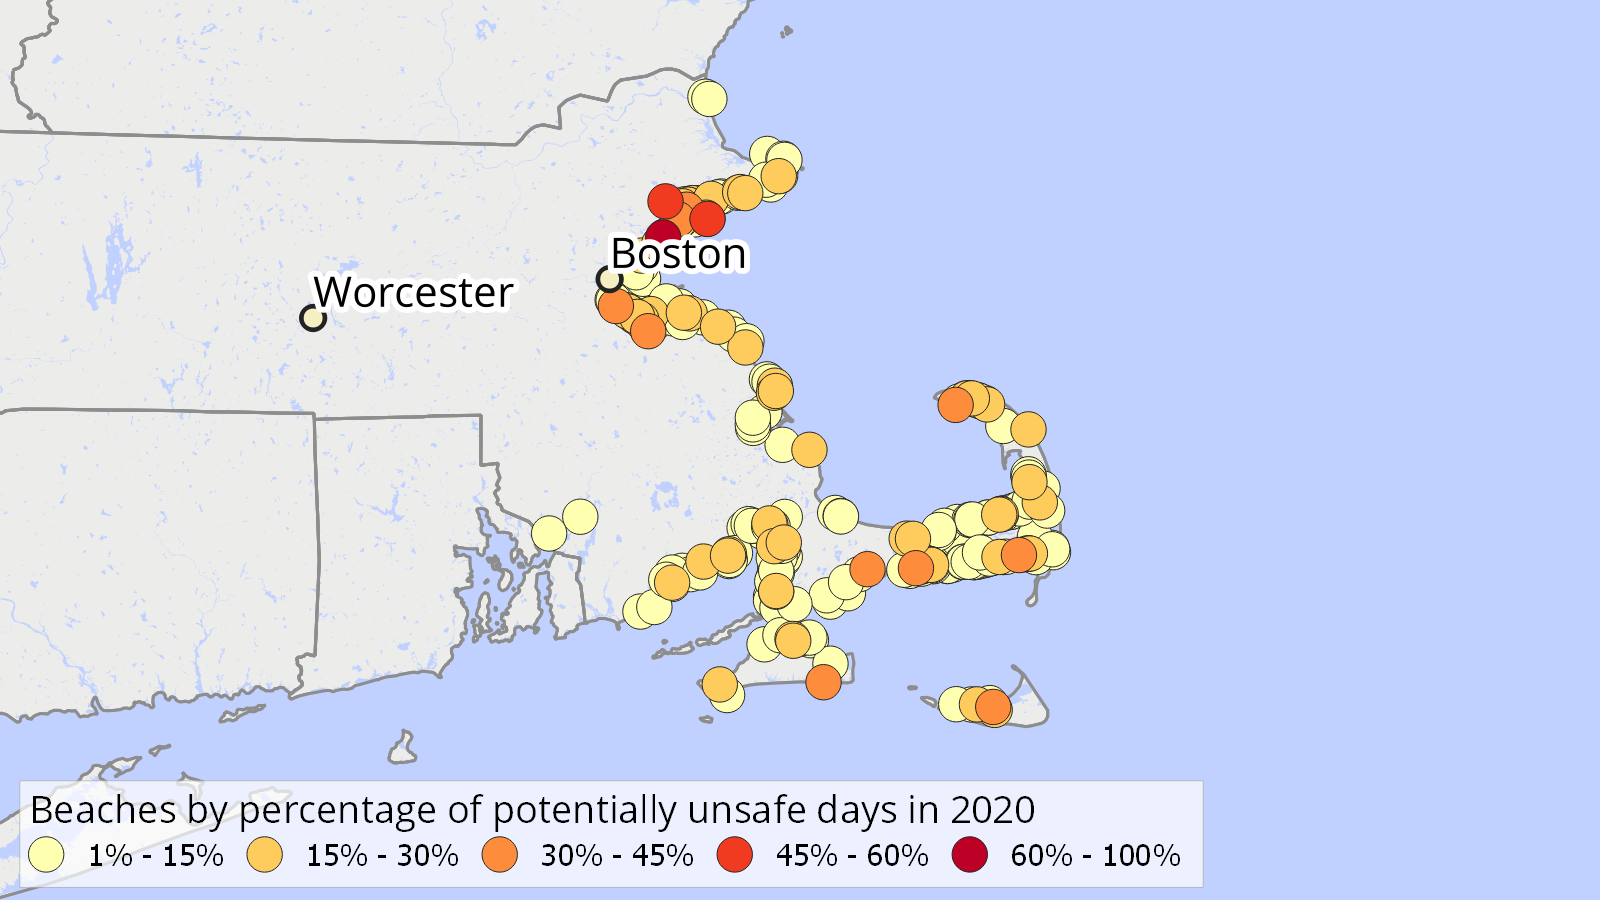
| Beach name | County | Potentially unsafe days in 2020 | Days with testing | Percentage of testing days with potentially unsafe water |
|---|---|---|---|---|
| King's Beach* | Essex County | 64 | 85 | 75% |
| Tenean Beach | Suffolk County | 29 | 85 | 34% |
| Wollaston Beach at Channing Street | Norfolk County | 23 | 85 | 27% |
| Wollaston Beach at Milton Street | Norfolk County | 19 | 85 | 22% |
| Wollaston Beach at Rice Road | Norfolk County | 16 | 85 | 19% |
| Wollaston Beach at Sachem Street | Norfolk County | 15 | 85 | 18% |
| Keyes Beach | Barnstable County | 12 | 30 | 40% |
| Malibu Beach | Suffolk County | 12 | 85 | 14% |
| Town Landing by Coast Guard | Barnstable County | 11 | 26 | 42% |
| Sandy Beach | Essex County | 8 | 14 | 57% |
* Beach has more than one associated testing site, which may affect number of potentially unsafe days.
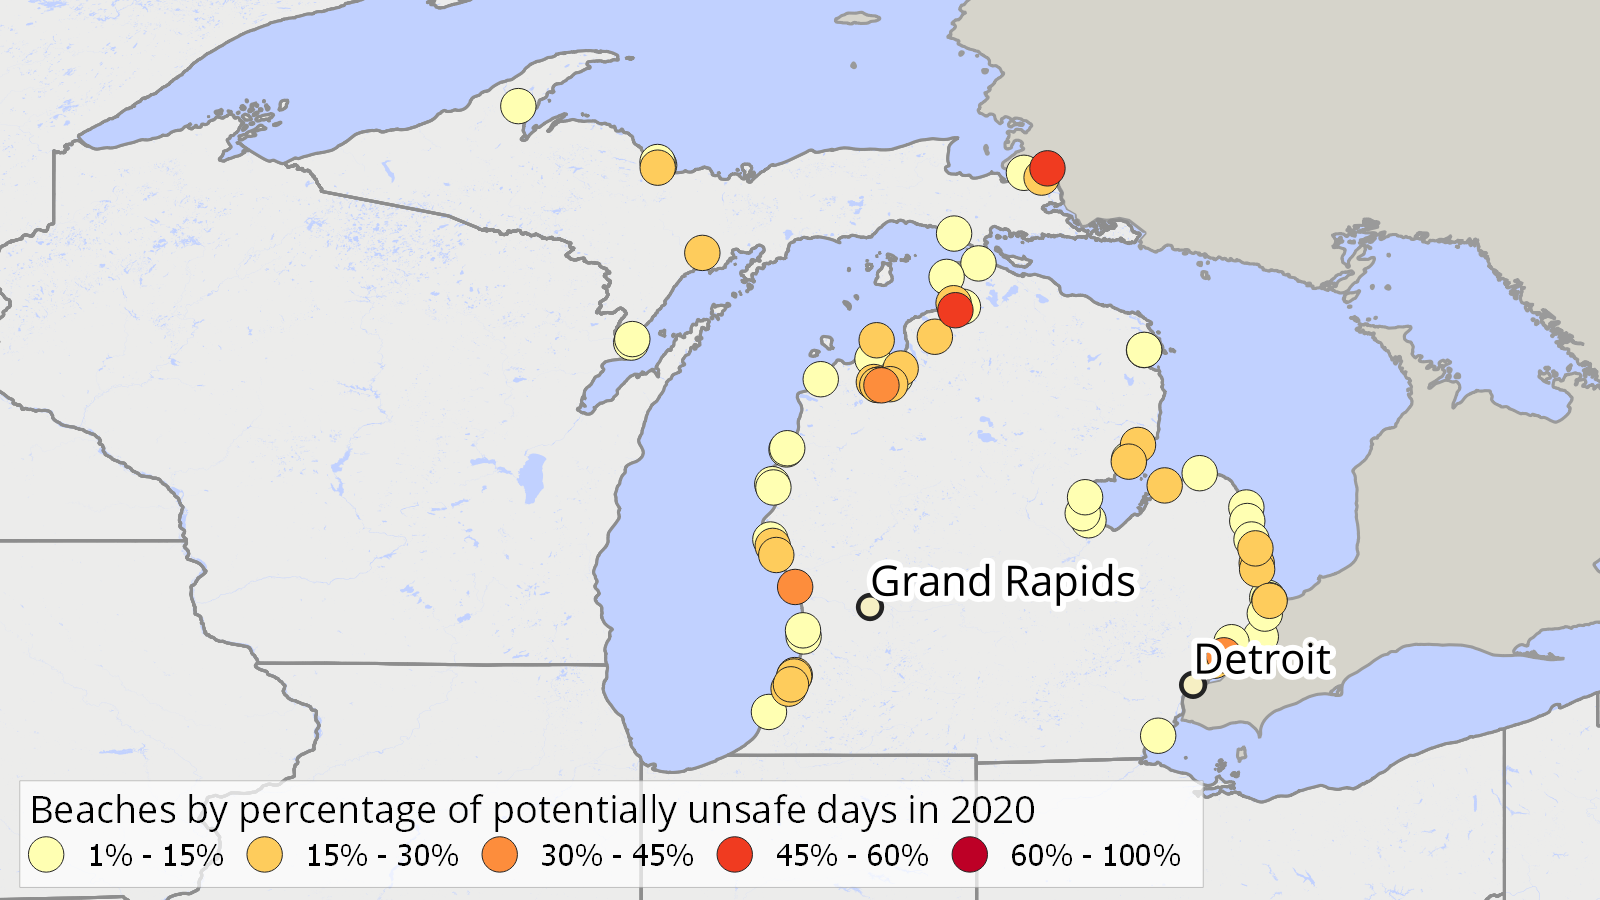
| Beach name | County | Potentially unsafe days in 2020 | Days with testing | Percentage of testing days with potentially unsafe water |
|---|---|---|---|---|
| Lake St. Clair Metropark Beach | Macomb County | 17 | 44 | 39% |
| St. Clair Shores Memorial Park Beach | Macomb County | 9 | 33 | 27% |
| East Bay Park | Grand Traverse County | 5 | 16 | 31% |
| Northport Bay Marina | Leelanau County | 5 | 17 | 29% |
| Sugar Island Township Park | Chippewa County | 4 | 8 | 50% |
| Conger-Lighthouse Beach | St. Clair County | 4 | 16 | 25% |
| Caseville County Park | Huron County | 4 | 17 | 24% |
| Sunset Park | Grand Traverse County | 4 | 18 | 22% |
| Gladstone Beach at Van Cleve Park | Delta County | 4 | 24 | 17% |
| Chrysler Park Beach | St. Clair County | 4 | 29 | 14% |
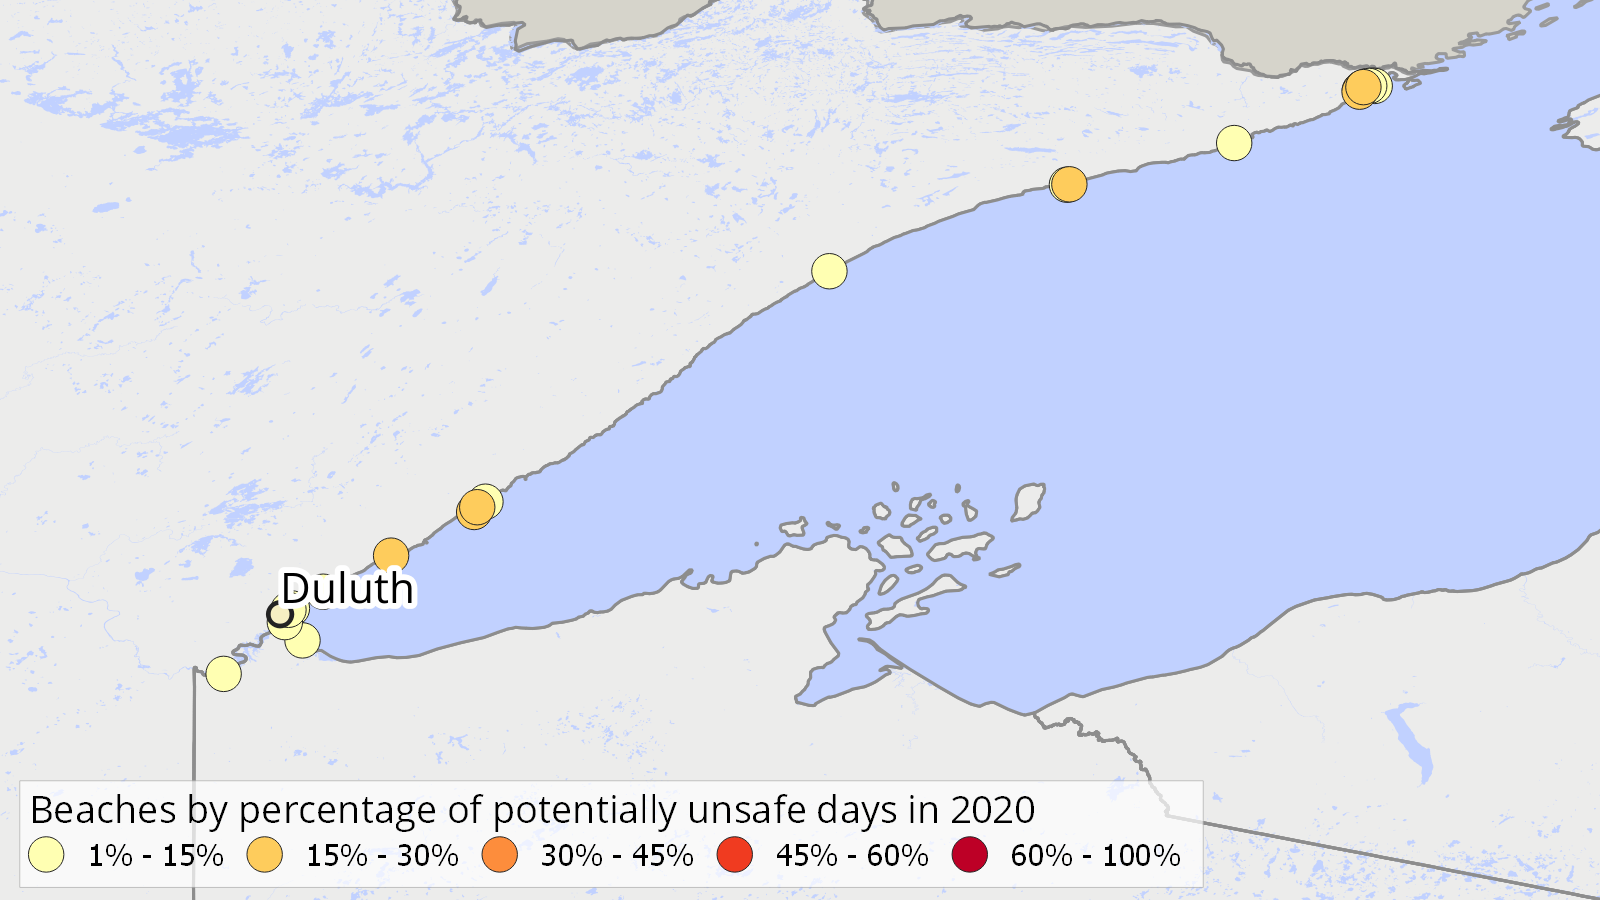
| Beach name | County | Potentially unsafe days in 2020 | Days with testing | Percentage of testing days with potentially unsafe water |
|---|---|---|---|---|
| Grand Portage Bay - Site 1† | Cook County | 10 | 44 | 23% |
| Grand Portage Bay - Site 2† | Cook County | 7 | 44 | 16% |
| Grand Marais Downtown Beach | Cook County | 4 | 15 | 27% |
| Grand Portage Bay - Site 2.5† | Cook County | 4 | 15 | 27% |
| Agate Bay Beach | Lake County | 4 | 17 | 24% |
| Burlington Bay Beach | Lake County | 4 | 17 | 24% |
| Leif Erikson Park Beach | St. Louis County | 4 | 27 | 15% |
| Grand Portage Bay - Site 1.5† | Cook County | 3 | 15 | 20% |
| Minnesota Point Harbor Side, 15th Street Beach | St. Louis County | 3 | 27 | 11% |
| Grand Portage Bay - Site 4† | Cook County | 3 | 44 | 7% |
| Grand Portage Bay - Site 6† | Cook County | 3 | 44 | 7% |
† Beach is under tribal jurisdiction.
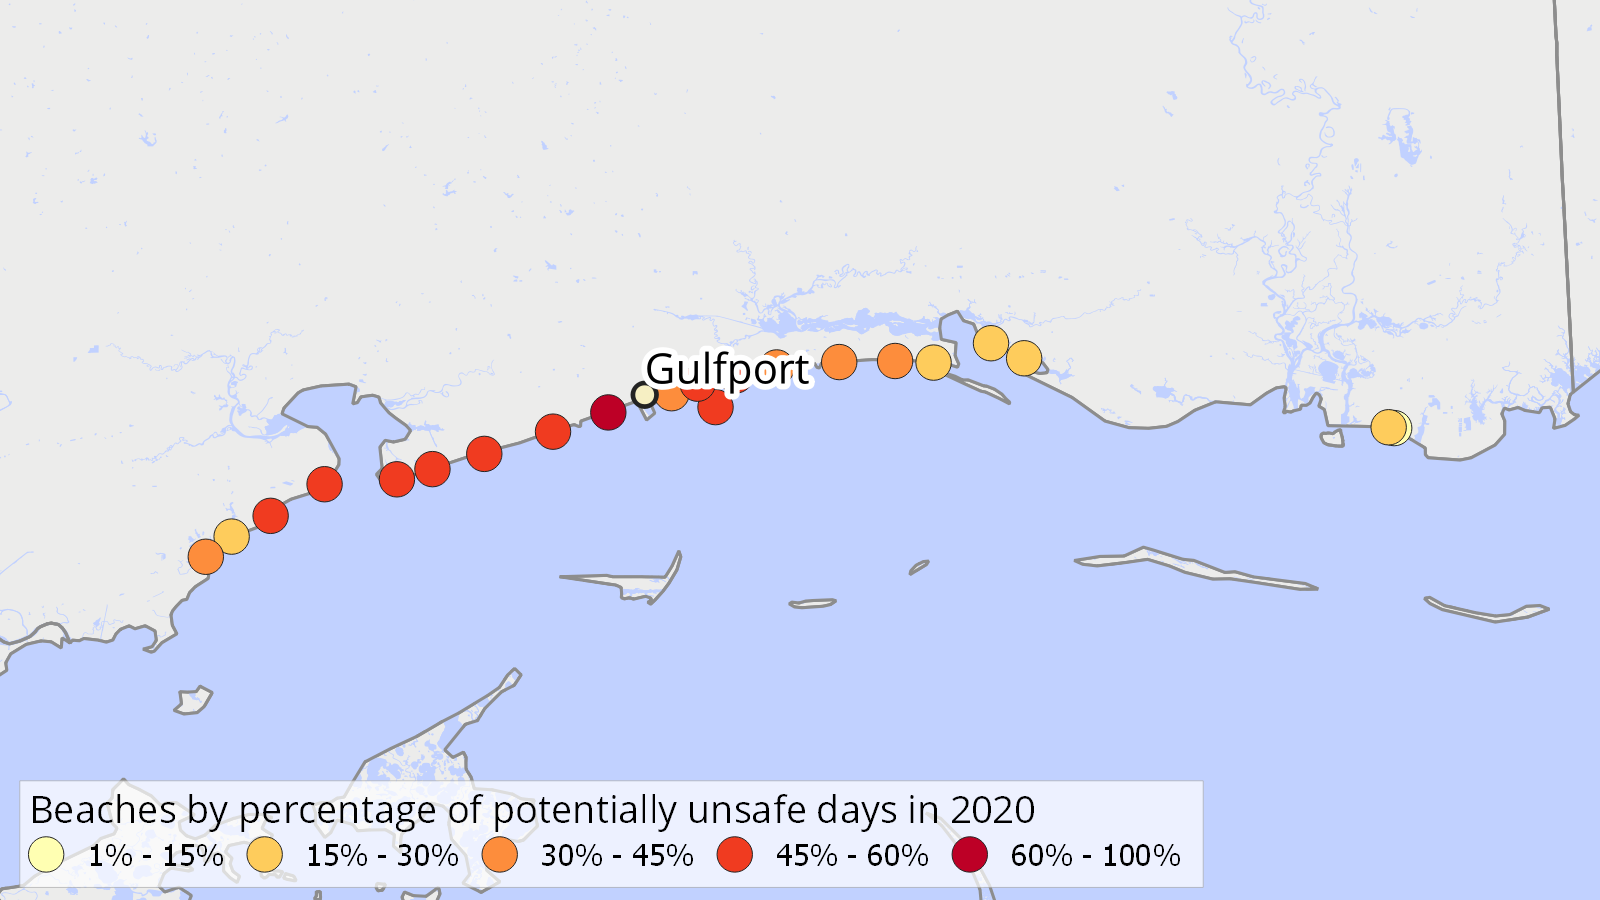
| Beach name | County | Potentially unsafe days in 2020 | Days with testing | Percentage of testing days with potentially unsafe water |
|---|---|---|---|---|
| Gulfport West Beach | Harrison County | 53 | 85 | 62% |
| Pass Christian Central Beach | Harrison County | 47 | 79 | 59% |
| Pass Christian West Beach | Harrison County | 40 | 71 | 56% |
| Gulfport Central Beach | Harrison County | 36 | 68 | 53% |
| Waveland Beach | Hancock County | 35 | 67 | 52% |
| Gulfport East Beach | Harrison County | 34 | 66 | 52% |
| East Courthouse Road Beach | Harrison County | 34 | 67 | 51% |
| Long Beach | Harrison County | 32 | 68 | 47% |
| Bay St. Louis Beach | Hancock County | 31 | 65 | 48% |
| Pass Christian East Beach | Harrison County | 30 | 62 | 48% |
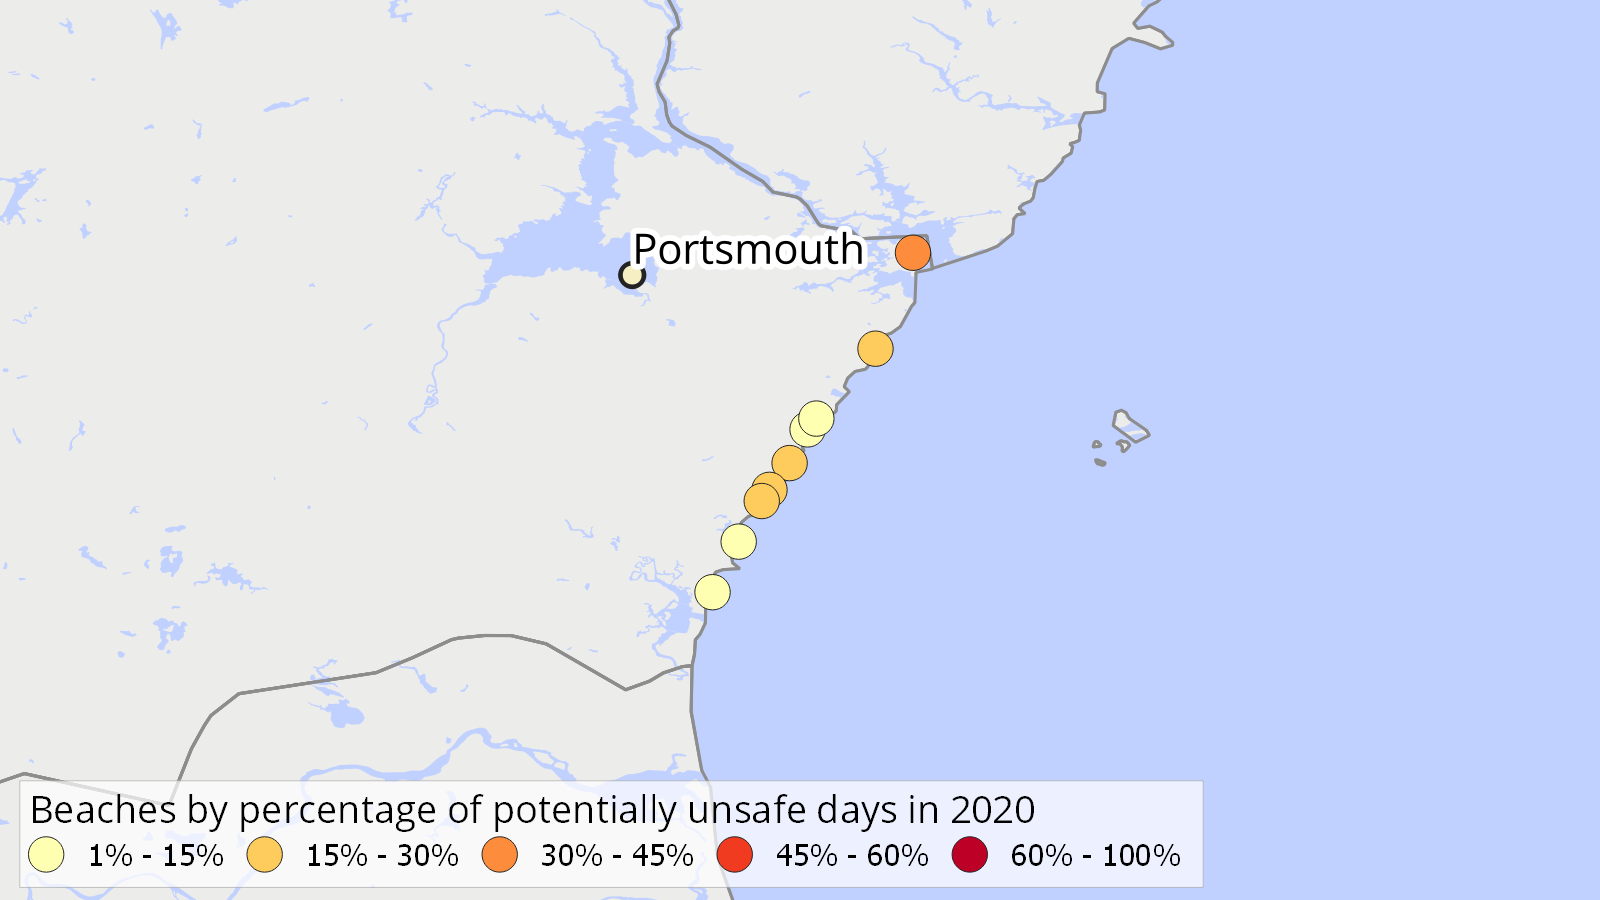
| Beach name | County | Potentially unsafe days in 2020 | Days with testing | Percentage of testing days with potentially unsafe water |
|---|---|---|---|---|
| New Castle Town Beach* | Rockingham County | 8 | 26 | 31% |
| North Hampton State Beach* | Rockingham County | 8 | 30 | 27% |
| Wallis Sands Beach at Wallis Road* | Rockingham County | 5 | 26 | 19% |
| Hampton Beach State Park* | Rockingham County | 3 | 25 | 12% |
| Northside Park* | Rockingham County | 2 | 7 | 29% |
| Bass Beach* | Rockingham County | 1 | 6 | 17% |
| Jenness Beach at Cable Road* | Rockingham County | 1 | 14 | 7% |
| North Beach* | Rockingham County | 1 | 14 | 7% |
| Jenness State Beach* | Rockingham County | 1 | 26 | 4% |
* Beach has more than one associated testing site, which may affect number of potentially unsafe days.
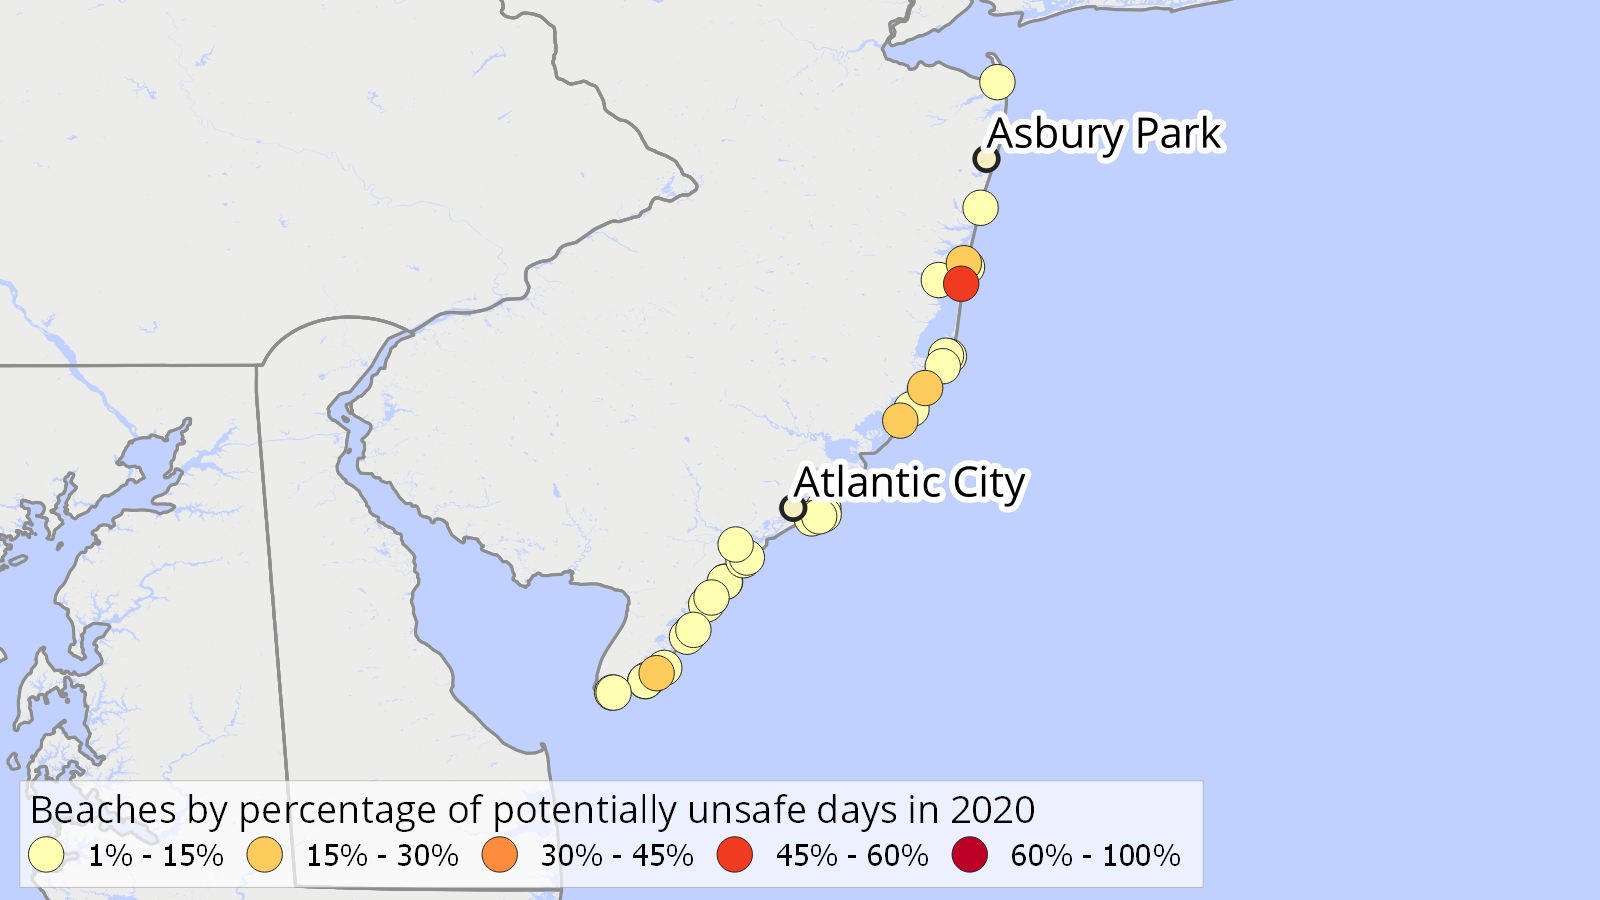
| Beach name | County | Potentially unsafe days in 2020 | Days with testing | Percentage of testing days with potentially unsafe water |
|---|---|---|---|---|
| Seaside Park Borough at 5th Ave. Bay Front* | Ocean County | 14 | 30 | 47% |
| Long Beach Township Bay Beach* | Ocean County | 4 | 14 | 29% |
| Surf City Bay Beach* | Ocean County | 4 | 17 | 24% |
| Wildwood City at Bennett Ave.* | Cape May County | 3 | 18 | 17% |
| Brooklyn Ave. Bay Beach* | Ocean County | 3 | 19 | 16% |
| Sea Isle City at 34th St. | Cape May County | 2 | 17 | 12% |
| Cape May City at Congress* | Cape May County | 2 | 18 | 11% |
| Atlantic City at St. James | Atlantic County | 1 | 12 | 8% |
| Long Beach Township at Loveladies Lane | Ocean County | 1 | 13 | 8% |
| Long Beach Township at Stockton* | Ocean County | 1 | 14 | 7% |
* Beach has more than one associated testing site, which may affect number of potentially unsafe days.
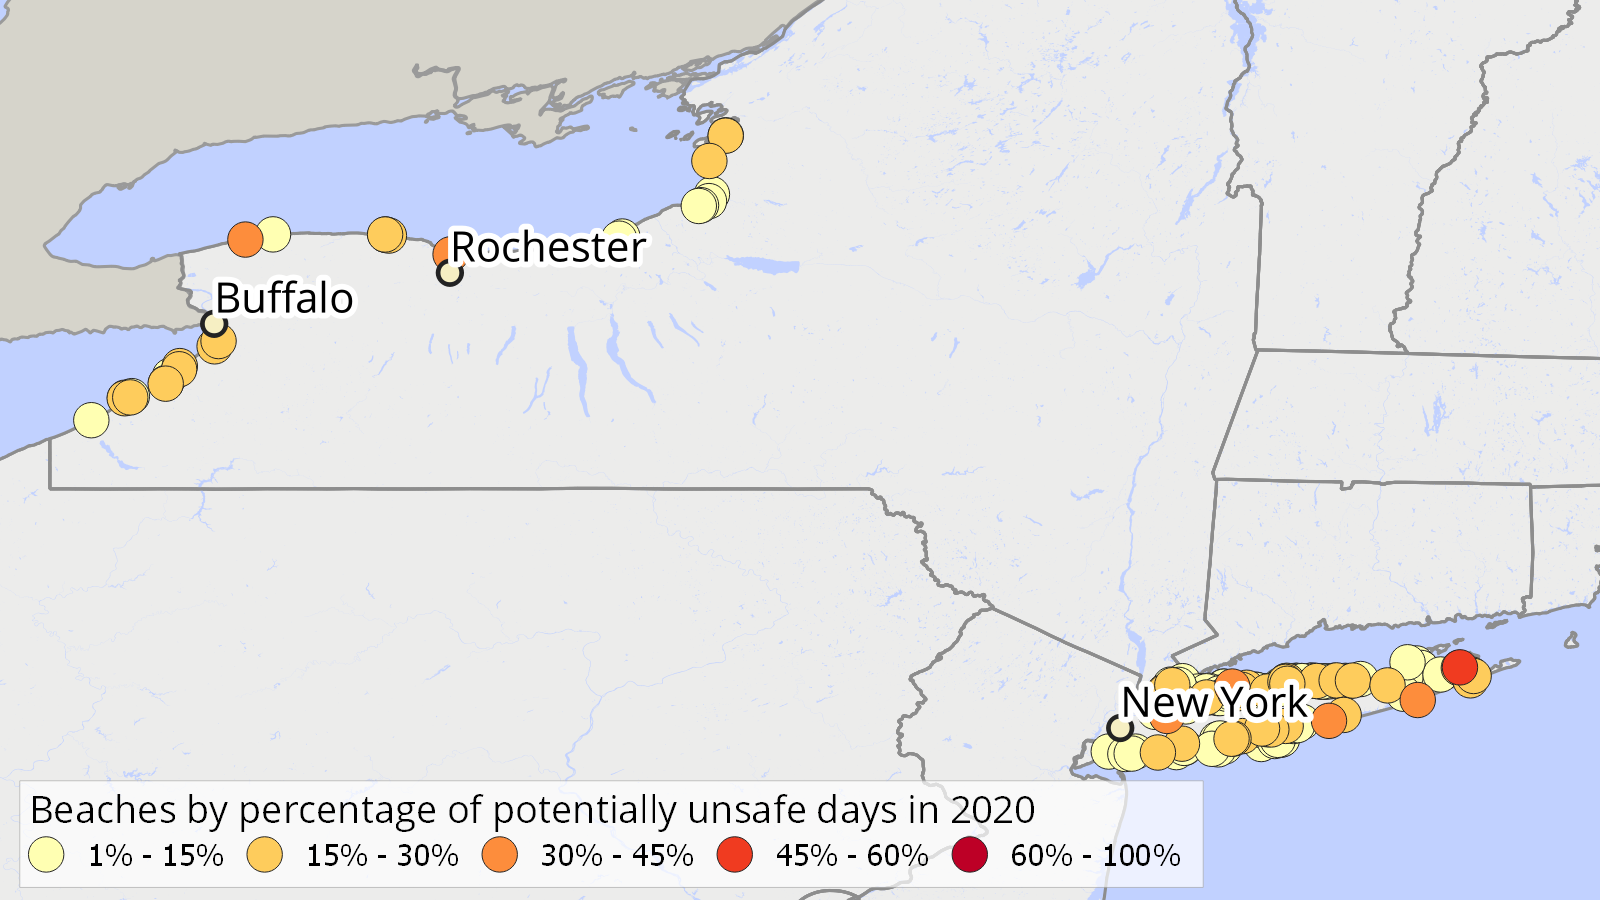
| Beach name | County | Potentially unsafe days in 2020 | Days with testing | Percentage of testing days with potentially unsafe water |
|---|---|---|---|---|
| Ontario Beach* | Monroe County | 34 | 79 | 43% |
| Woodlawn Beach State Park* | Erie County | 30 | 109 | 28% |
| Valley Grove Beach | Suffolk County | 23 | 54 | 43% |
| Hamburg Beach | Erie County | 15 | 69 | 22% |
| Tanner Park | Suffolk County | 11 | 47 | 23% |
| Benjamin's Beach | Suffolk County | 10 | 43 | 23% |
| Venetian Shores | Suffolk County | 10 | 45 | 22% |
| Hamlin Beach State Park | Monroe County | 9 | 33 | 27% |
| Amityville Beach | Suffolk County | 9 | 37 | 24% |
| Main Street Beach* | Chautauqua County | 7 | 26 | 27% |
* Beach has more than one associated testing site, which may affect number of potentially unsafe days.

| Beach name | County | Potentially unsafe days in 2020 | Days with testing | Percentage of testing days with potentially unsafe water |
|---|---|---|---|---|
| Pamlico River at the railroad trestle | Beaufort County | 10 | 17 | 59% |
| Pamlico River at Havens Gardens Park | Beaufort County | 9 | 19 | 47% |
| Holden Beach | Brunswick County | 7 | 17 | 41% |
| Beach by Vandemere Creek | Pamlico County | 7 | 19 | 37% |
| Jockey's Ridge Beach | Dare County | 7 | 30 | 23% |
| Beach at Pantego Creek | Beaufort County | 7 | 32 | 22% |
| Beach at Union Point | Craven County | 5 | 16 | 31% |
| Carolina Beach | New Hanover County | 5 | 18 | 28% |
| Hancock Creek | Craven County | 4 | 15 | 27% |
| Lennoxville Boat Ramp in Beaufort | Carteret County | 4 | 17 | 24% |
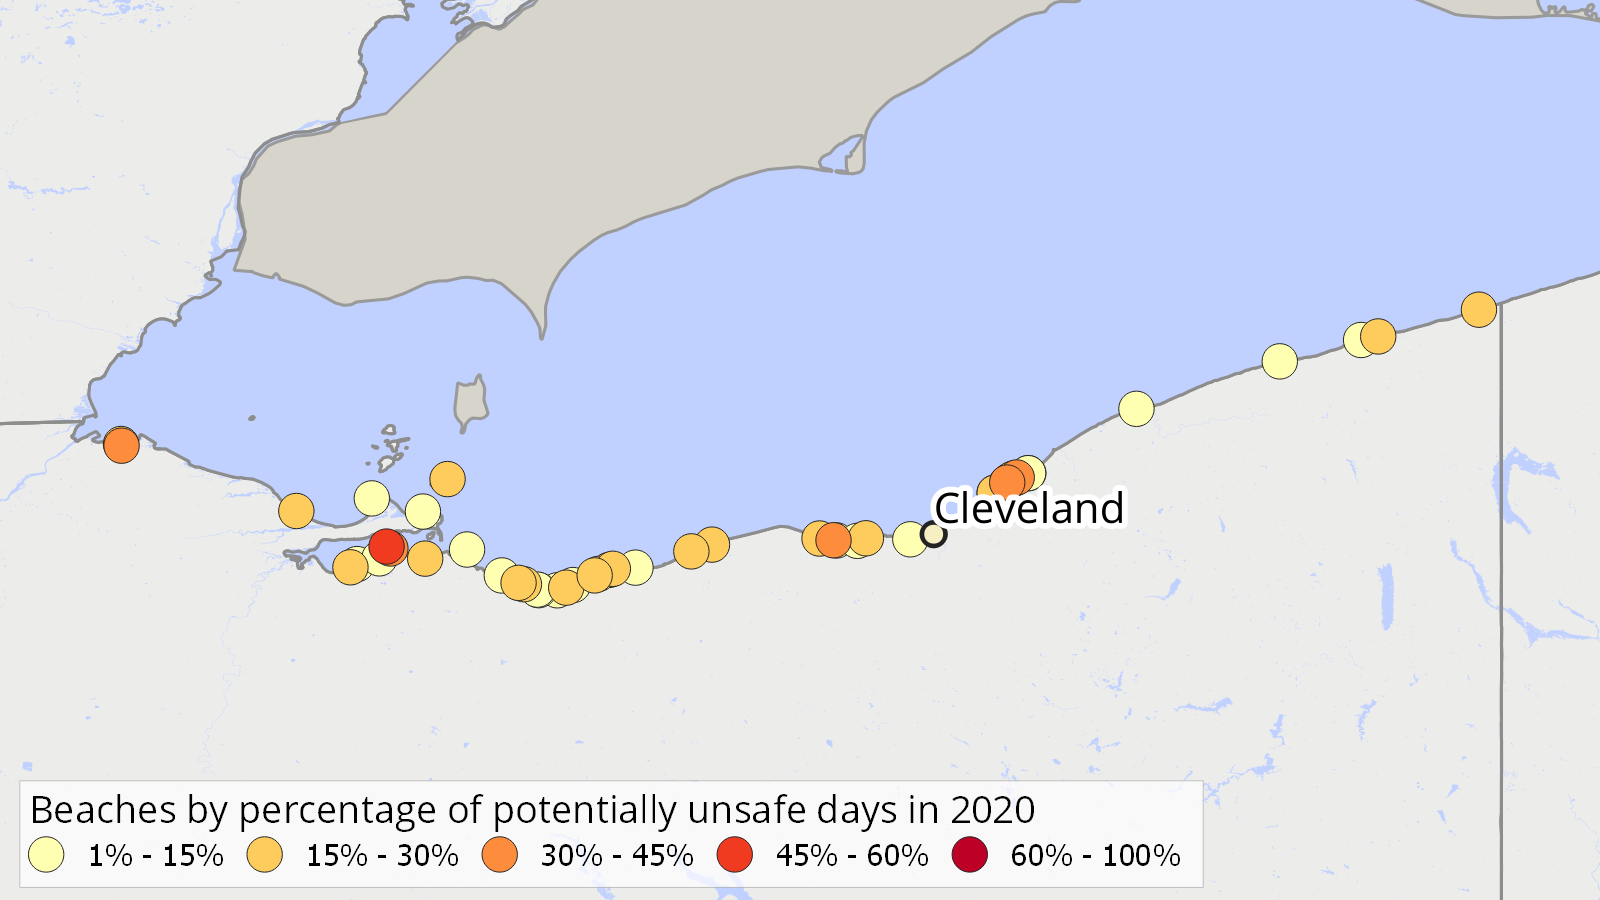
| Beach name | County | Potentially unsafe days in 2020 | Days with testing | Percentage of testing days with potentially unsafe water |
|---|---|---|---|---|
| Bay View West | Erie County | 36 | 76 | 47% |
| Bay View East | Erie County | 27 | 77 | 35% |
| Villa Angela State Park | Cuyahoga County | 27 | 112 | 24% |
| Maumee Bay Inland Beach | Lucas County | 21 | 51 | 41% |
| Lake Front Park | Erie County | 21 | 76 | 28% |
| Huntington Beach | Cuyahoga County | 21 | 109 | 19% |
| Euclid State Park | Cuyahoga County | 20 | 113 | 18% |
| Lagoons Beach | Erie County | 19 | 78 | 24% |
| Sherod Park Beach | Erie County | 18 | 78 | 23% |
| Main Street Beach | Erie County | 16 | 78 | 21% |
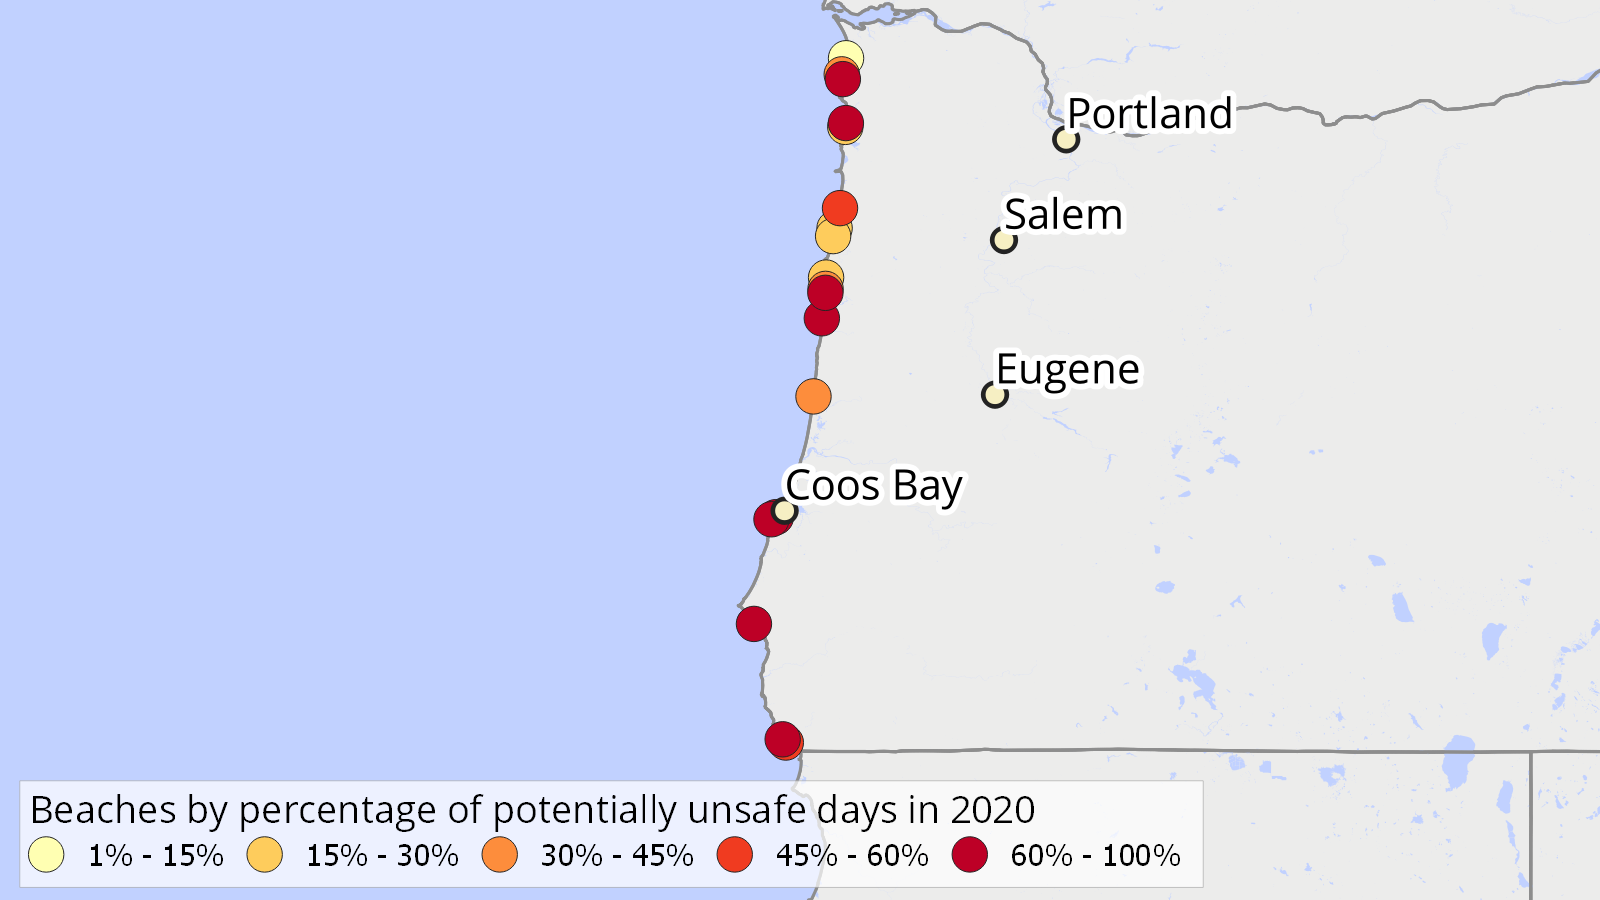
| Beach name | County | Potentially unsafe days in 2020 | Days with testing | Percentage of testing days with potentially unsafe water |
|---|---|---|---|---|
| Nye Beach* | Lincoln County | 9 | 10 | 90% |
| Seal Rock State Recreation Site* | Lincoln County | 7 | 10 | 70% |
| Sunset Bay State Park* | Coos County | 6 | 7 | 86% |
| Bastendorf Beach* | Coos County | 5 | 6 | 83% |
| Harris Beach State Park* | Curry County | 5 | 6 | 83% |
| Rockaway Beach* | Tillamook County | 5 | 6 | 83% |
| Tolovana Beach State Wayside* | Clatsop County | 5 | 7 | 71% |
| Hubbard Creek Beach at Humbug Mountain State Park* | Curry County | 4 | 6 | 67% |
| Cannon Beach* | Clatsop County | 4 | 9 | 44% |
| Mill Beach* | Curry County | 3 | 6 | 50% |
| Neskowin Beach State Wayside* | Tillamook County | 3 | 6 | 50% |
* Beach has more than one associated testing site, which may affect number of potentially unsafe days.
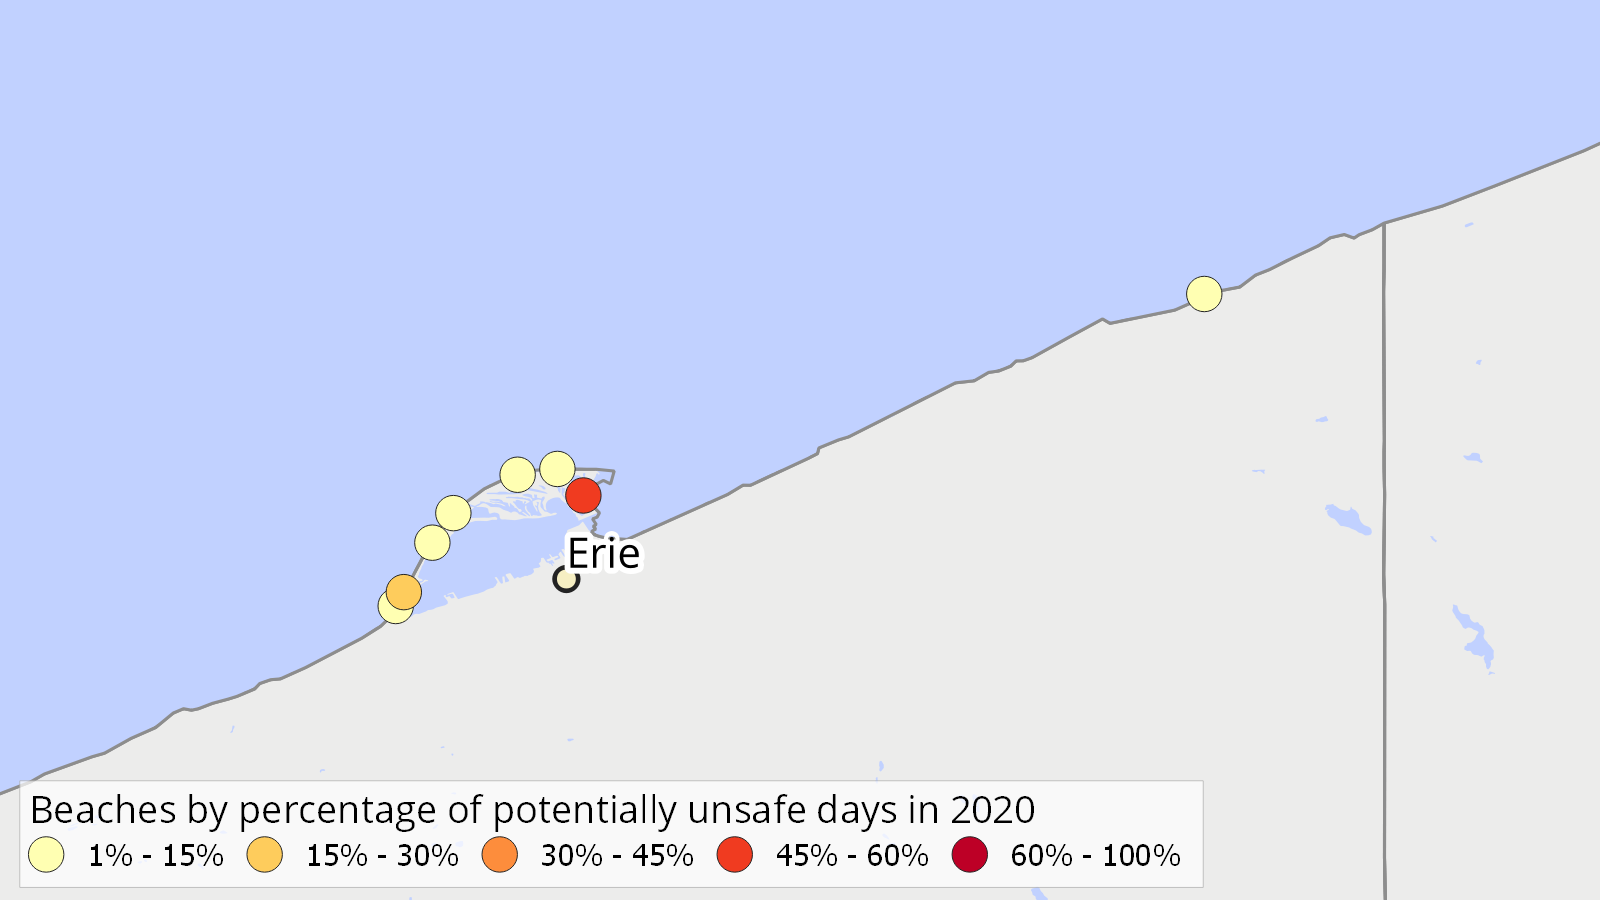
| Beach name | County | Potentially unsafe days in 2020 | Days with testing | Percentage of testing days with potentially unsafe water |
|---|---|---|---|---|
| Erie Beach 11* | Erie County | 11 | 24 | 46% |
| Barracks Beach* | Erie County | 8 | 30 | 27% |
| Erie Beach 6* | Erie County | 4 | 28 | 14% |
| Erie Beach 9 (Pine Tree Beach)* | Erie County | 3 | 24 | 12% |
| Erie Beach 1 East* | Erie County | 2 | 24 | 8% |
| Erie Beach 8 (Pettinato Beach)* | Erie County | 2 | 28 | 7% |
| Freeport Beach* | Erie County | 1 | 13 | 8% |
| Erie Beach 10 (Bundy Beach)* | Erie County | 1 | 26 | 4% |
* Beach has more than one associated testing site, which may affect number of potentially unsafe days.
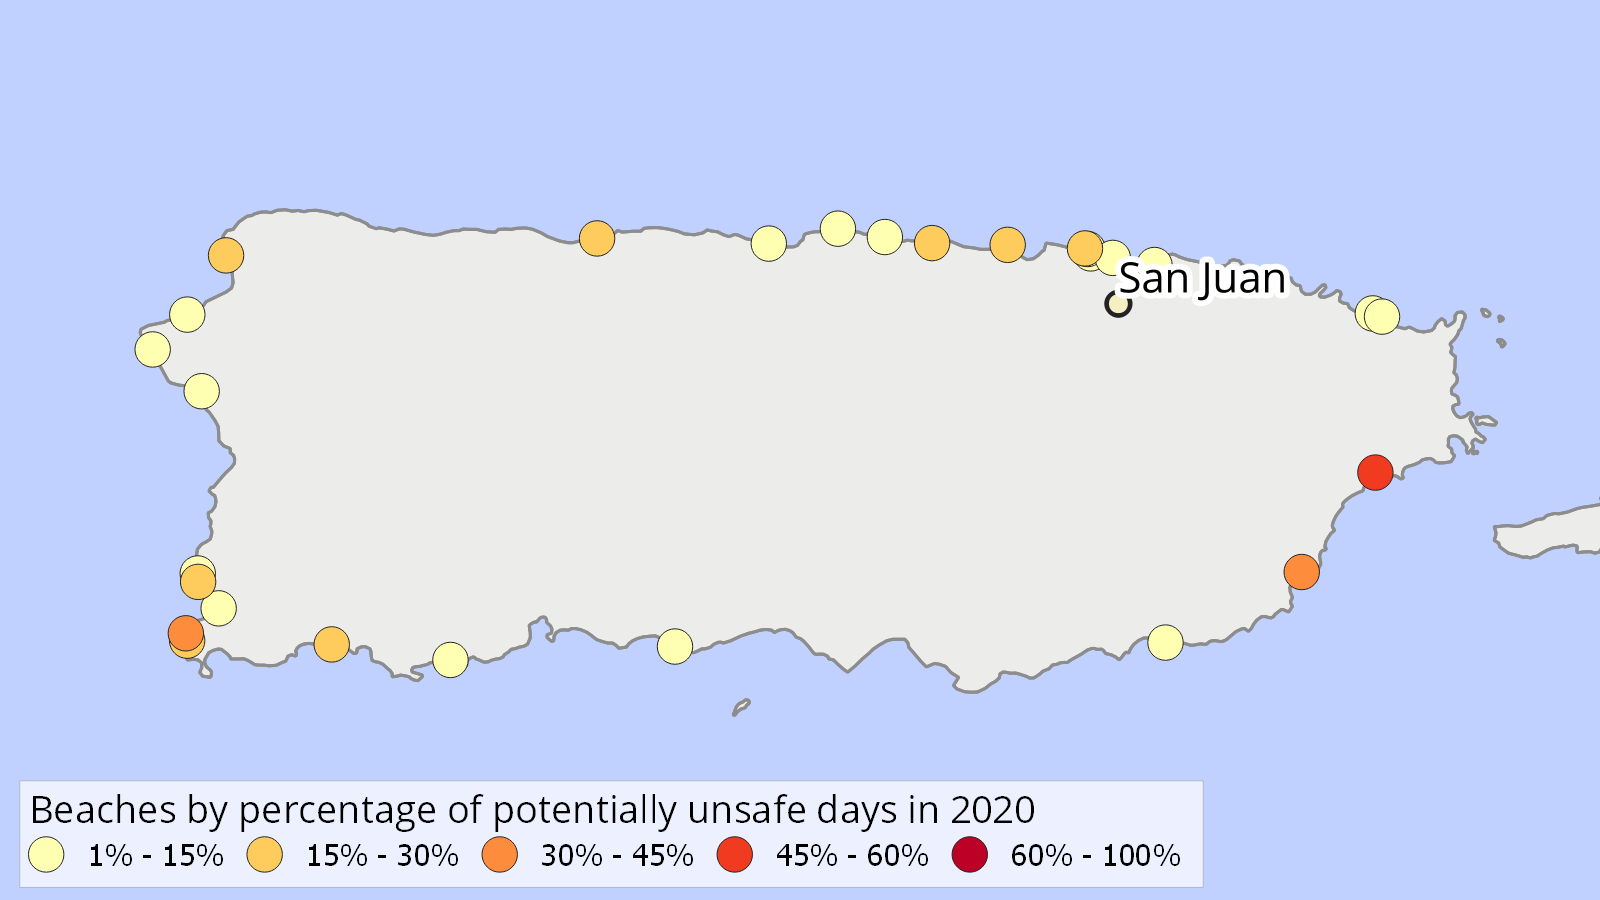
| Beach name | Municipio | Potentially unsafe days in 2020 | Days with testing | Percentage of testing days with potentially unsafe water |
|---|---|---|---|---|
| Tropical Beach | Naguabo Municipio | 11 | 20 | 55% |
| Playa Mojacasabe | Cabo Rojo Municipio | 7 | 20 | 35% |
| Playa Guayanes | Yabucoa Municipio | 6 | 19 | 32% |
| Balneario Sardinera | Dorado Municipio | 5 | 18 | 28% |
| Muelle de Arecibo | Arecibo Municipio | 5 | 18 | 28% |
| Balneario Crash Boat Beach | Aguadilla Municipio | 4 | 17 | 24% |
| Playa El Combate | Cabo Rojo Municipio | 4 | 17 | 24% |
| Balneario El Escambron | San Juan Municipio | 4 | 19 | 21% |
| Playa Buye | Cabo Rojo Municipio | 4 | 20 | 20% |
| Playita Rosada, Lajas | Lajas Municipio | 3 | 14 | 21% |
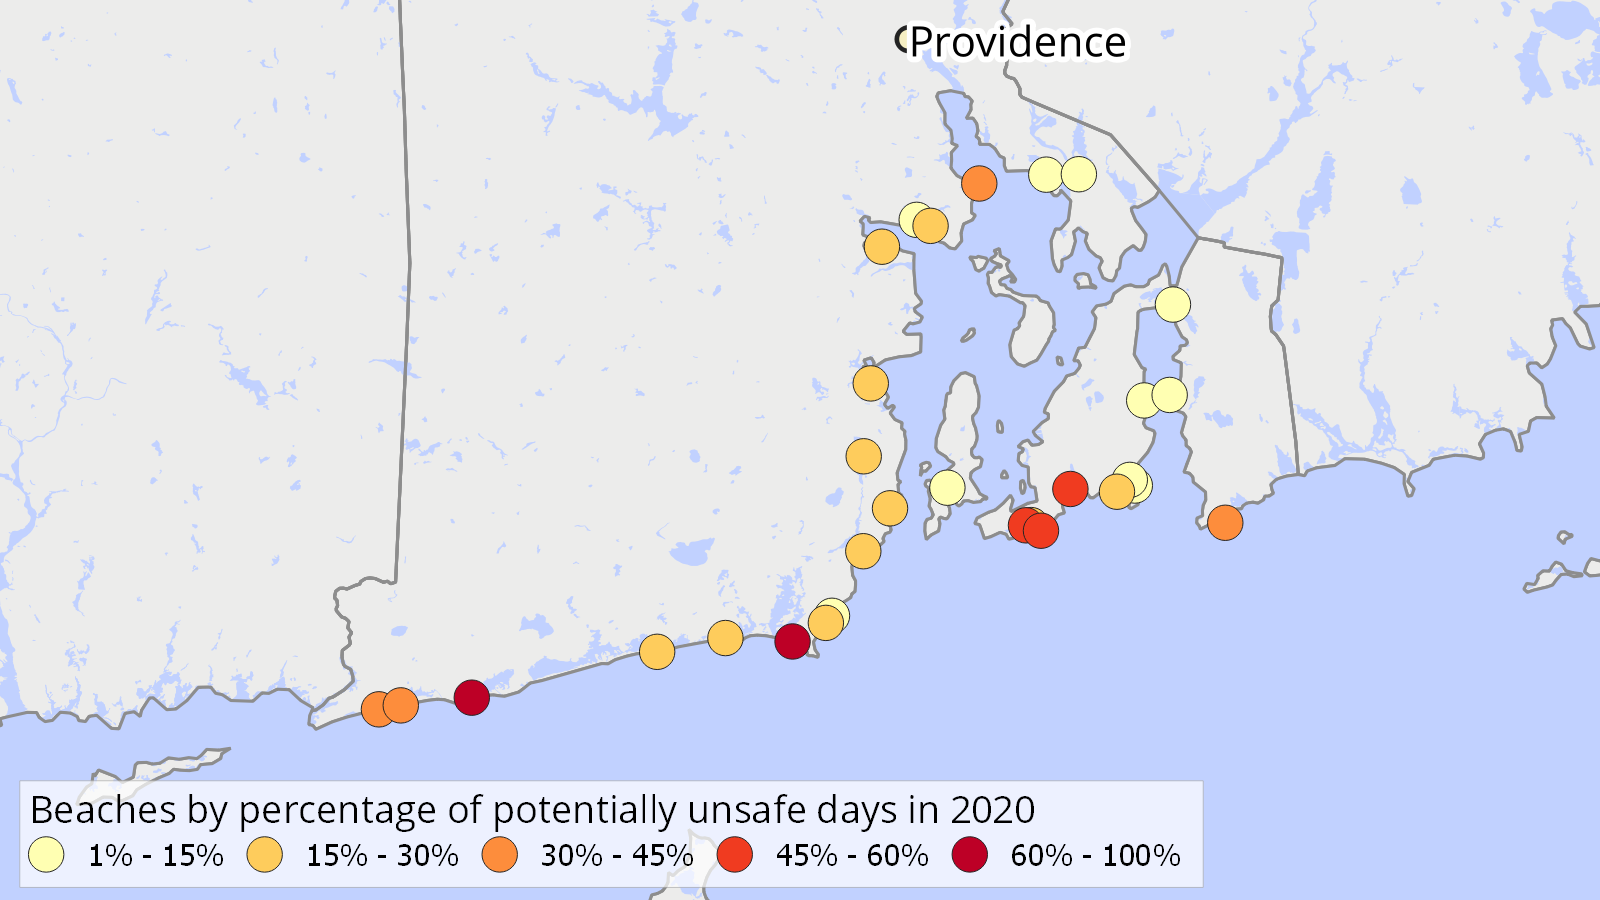
| Beach name | County | Potentially unsafe days in 2020 | Days with testing | Percentage of testing days with potentially unsafe water |
|---|---|---|---|---|
| Easton's Beach* | Newport County | 16 | 29 | 55% |
| Conimicut Point Beach* | Kent County | 9 | 29 | 31% |
| Oakland Beach* | Kent County | 7 | 29 | 24% |
| Hazard's Beach* | Newport County | 6 | 13 | 46% |
| Scarborough State Beach South* | Washington County | 6 | 29 | 21% |
| Goddard Memorial State Park* | Kent County | 5 | 29 | 17% |
| Roger Wheeler State Beach* | Washington County | 4 | 6 | 67% |
| Scarborough State Beach North* | Washington County | 4 | 29 | 14% |
| Warren Town Beach | Bristol County | 4 | 29 | 14% |
| Bailey Beach* | Newport County | 3 | 6 | 50% |
* Beach has more than one associated testing site, which may affect number of potentially unsafe days.
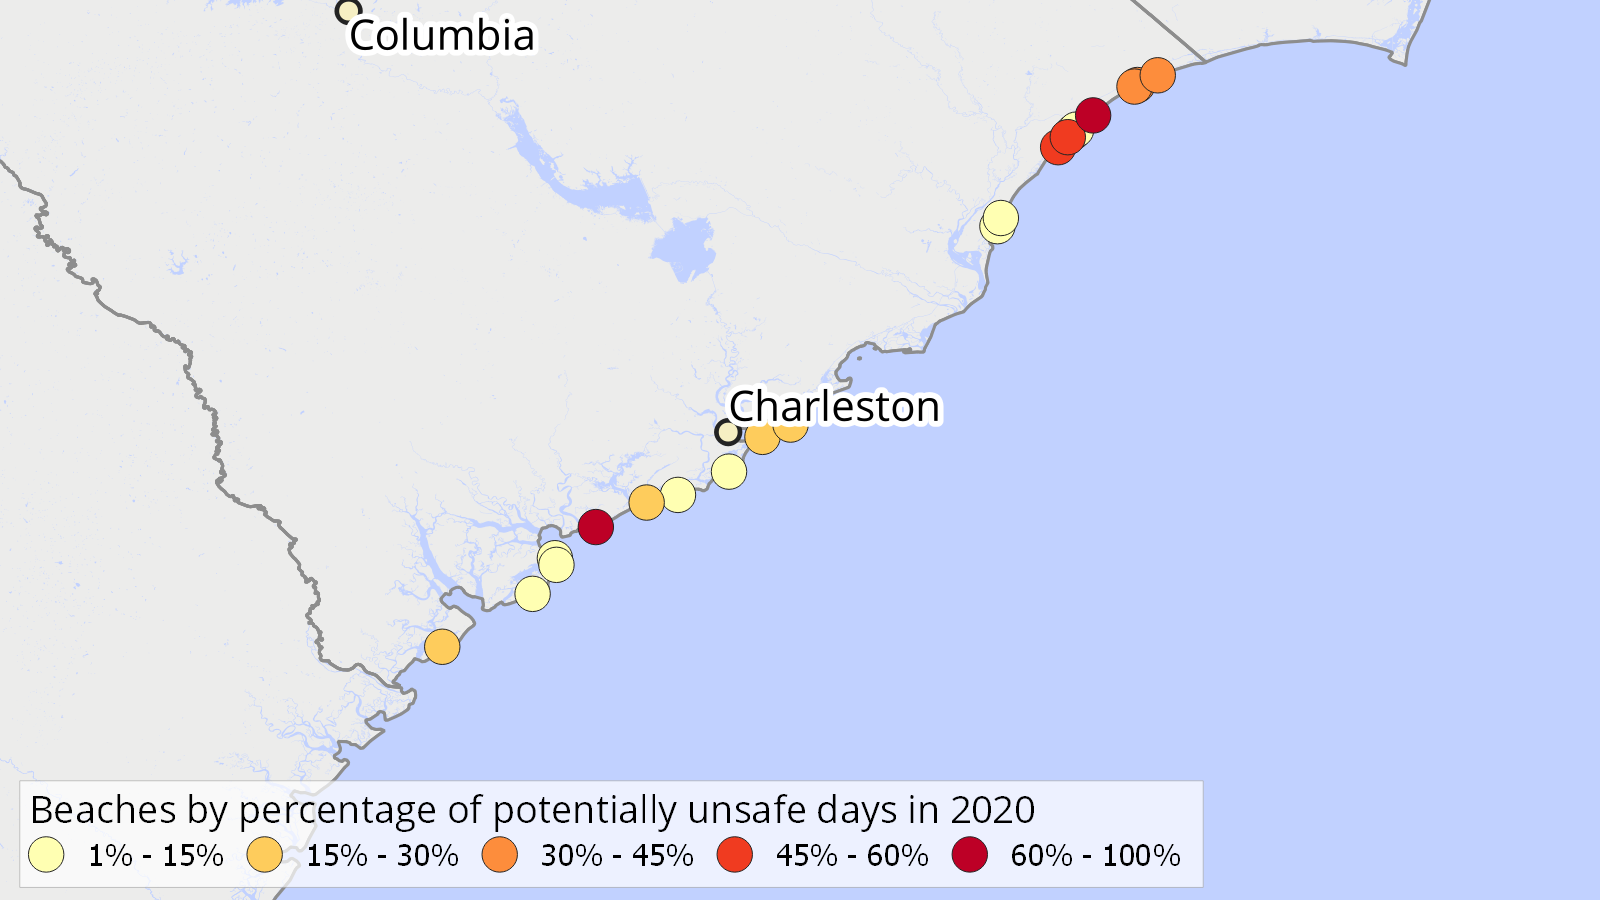
| Beach name | County | Potentially unsafe days in 2020 | Days with testing | Percentage of testing days with potentially unsafe water |
|---|---|---|---|---|
| Myrtle Beach* | Horry County | 70 | 82 | 85% |
| North Myrtle Beach* | Horry County | 29 | 87 | 33% |
| Briarcliffe Acres Beach* | Horry County | 24 | 74 | 32% |
| Beach at Horry County Campgrounds* | Horry County | 16 | 28 | 57% |
| Surfside Beach* | Horry County | 15 | 30 | 50% |
| Arcadia Beach* | Horry County | 9 | 27 | 33% |
| Edisto Island* | Charleston County | 7 | 11 | 64% |
| Hilton Head Island* | Beaufort County | 2 | 10 | 20% |
| Isle of Palms* | Charleston County | 2 | 10 | 20% |
| Seabrook Island* | Charleston County | 2 | 10 | 20% |
* Beach has more than one associated testing site, which may affect number of potentially unsafe days.
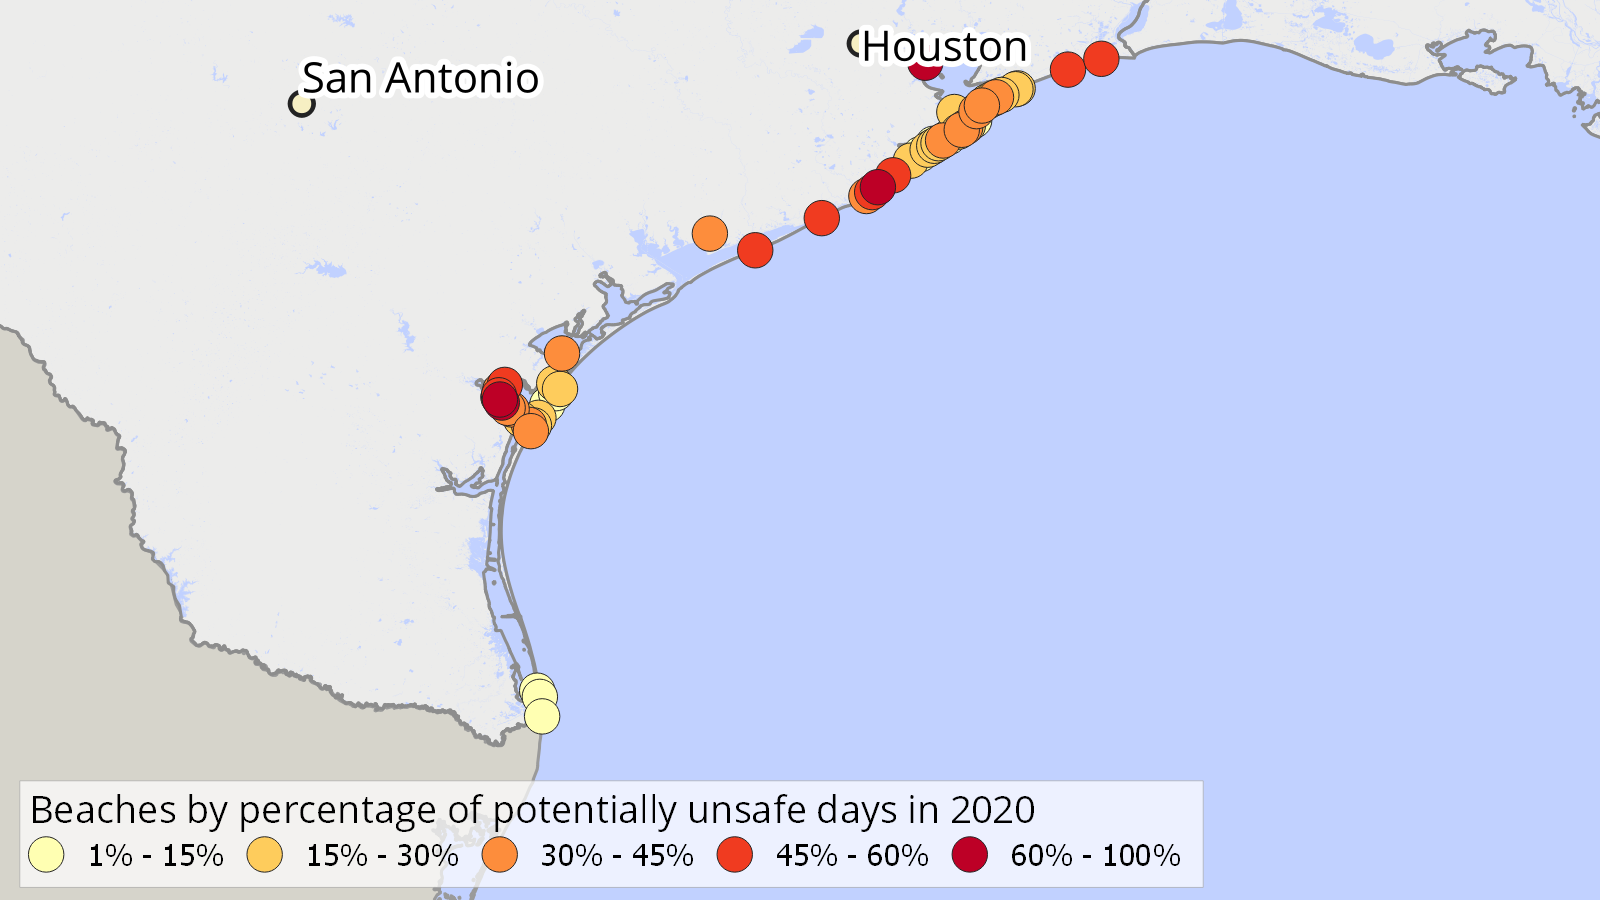
| Beach name | County | Potentially unsafe days in 2020 | Days with testing | Percentage of testing days with potentially unsafe water |
|---|---|---|---|---|
| Cole Park* | Nueces County | 62 | 68 | 91% |
| Ropes Park* | Nueces County | 40 | 54 | 74% |
| Surfside Beach* | Brazoria County | 34 | 47 | 72% |
| Sylvan Beach Park* | Harris County | 27 | 44 | 61% |
| Follet's Island* | Brazoria County | 25 | 44 | 57% |
| Corpus Christi Marina* | Nueces County | 23 | 40 | 57% |
| Quintana Beach* | Brazoria County | 23 | 43 | 53% |
| Sargent Beach* | Matagorda County | 20 | 40 | 50% |
| Jetty Park* | Matagorda County | 20 | 43 | 47% |
| Nueces Bay Causeway #3 | San Patricio County | 18 | 38 | 47% |
* Beach has more than one associated testing site, which may affect number of potentially unsafe days.
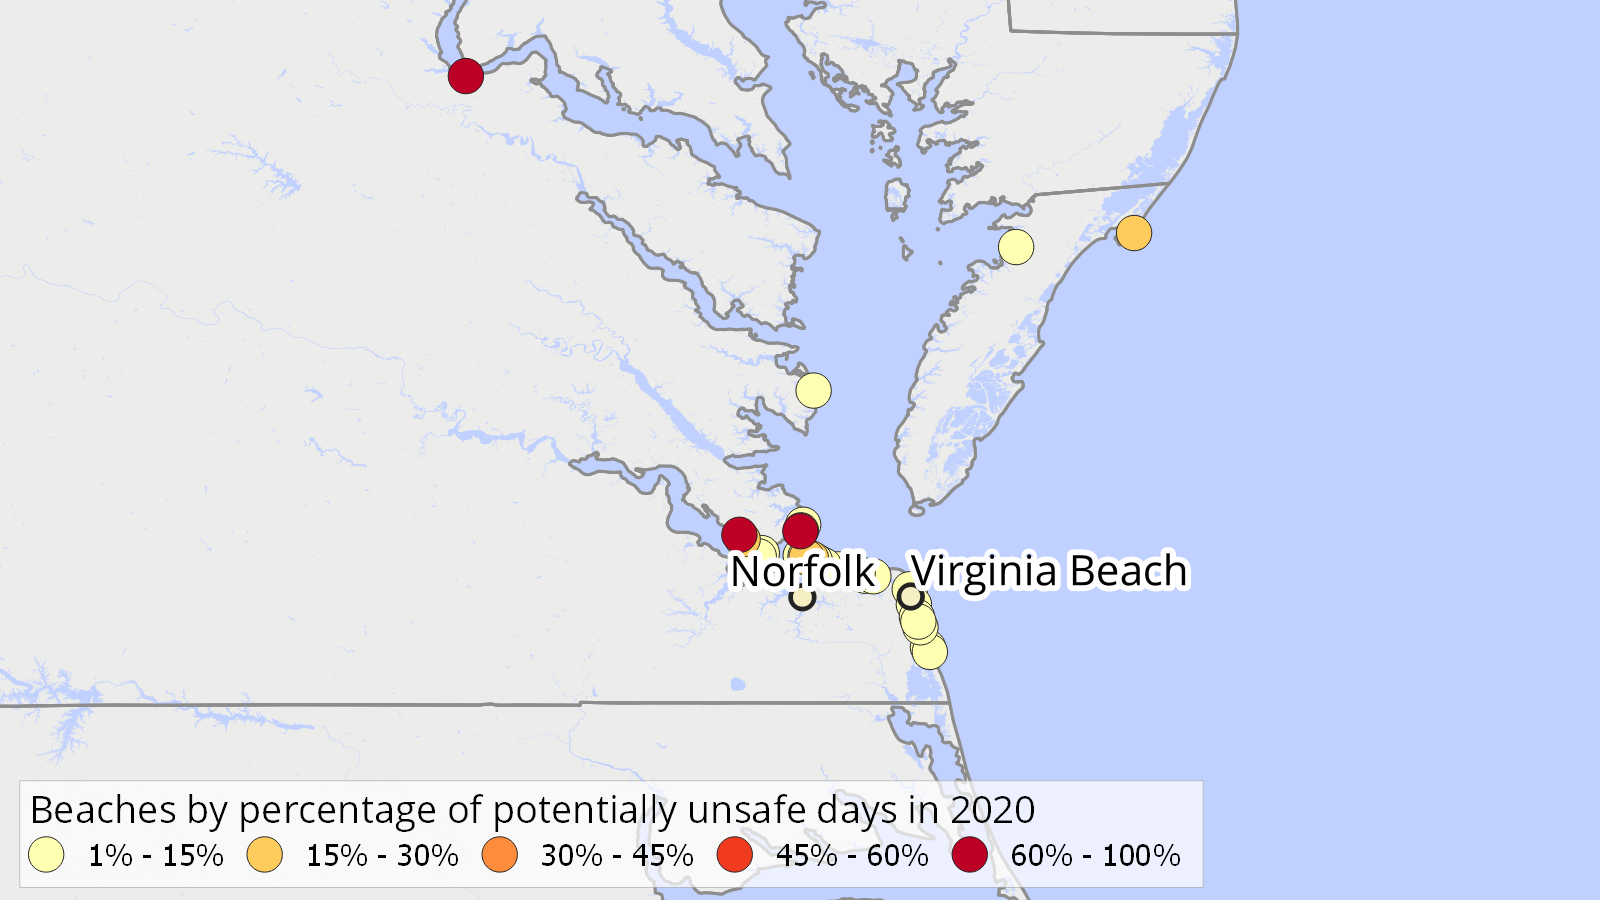
| Beach name | County/independent city | Potentially unsafe days in 2020 | Days with testing | Percentage of testing days with potentially unsafe water |
|---|---|---|---|---|
| Hilton Beach | Newport News city | 10 | 14 | 71% |
| Fairview Beach | King George County | 8 | 9 | 89% |
| Buckroe Beach | Hampton city | 4 | 12 | 33% |
| Assateague Virginia* | Accomack County | 3 | 15 | 20% |
| Huntington Beach | Newport News city | 3 | 15 | 20% |
| Captains Quarters | Norfolk city | 3 | 18 | 17% |
| Sarah Constant Beach Park, East End | Norfolk city | 3 | 18 | 17% |
| Guard Shore | Accomack County | 2 | 14 | 14% |
| King/Lincoln Park | Newport News city | 2 | 15 | 13% |
| Beach at 10th View | Norfolk city | 2 | 18 | 11% |
| Beach at 13th View | Norfolk city | 2 | 18 | 11% |
| Ocean View Park | Norfolk city | 2 | 18 | 11% |
* Beach has more than one associated testing site, which may affect number of potentially unsafe days.
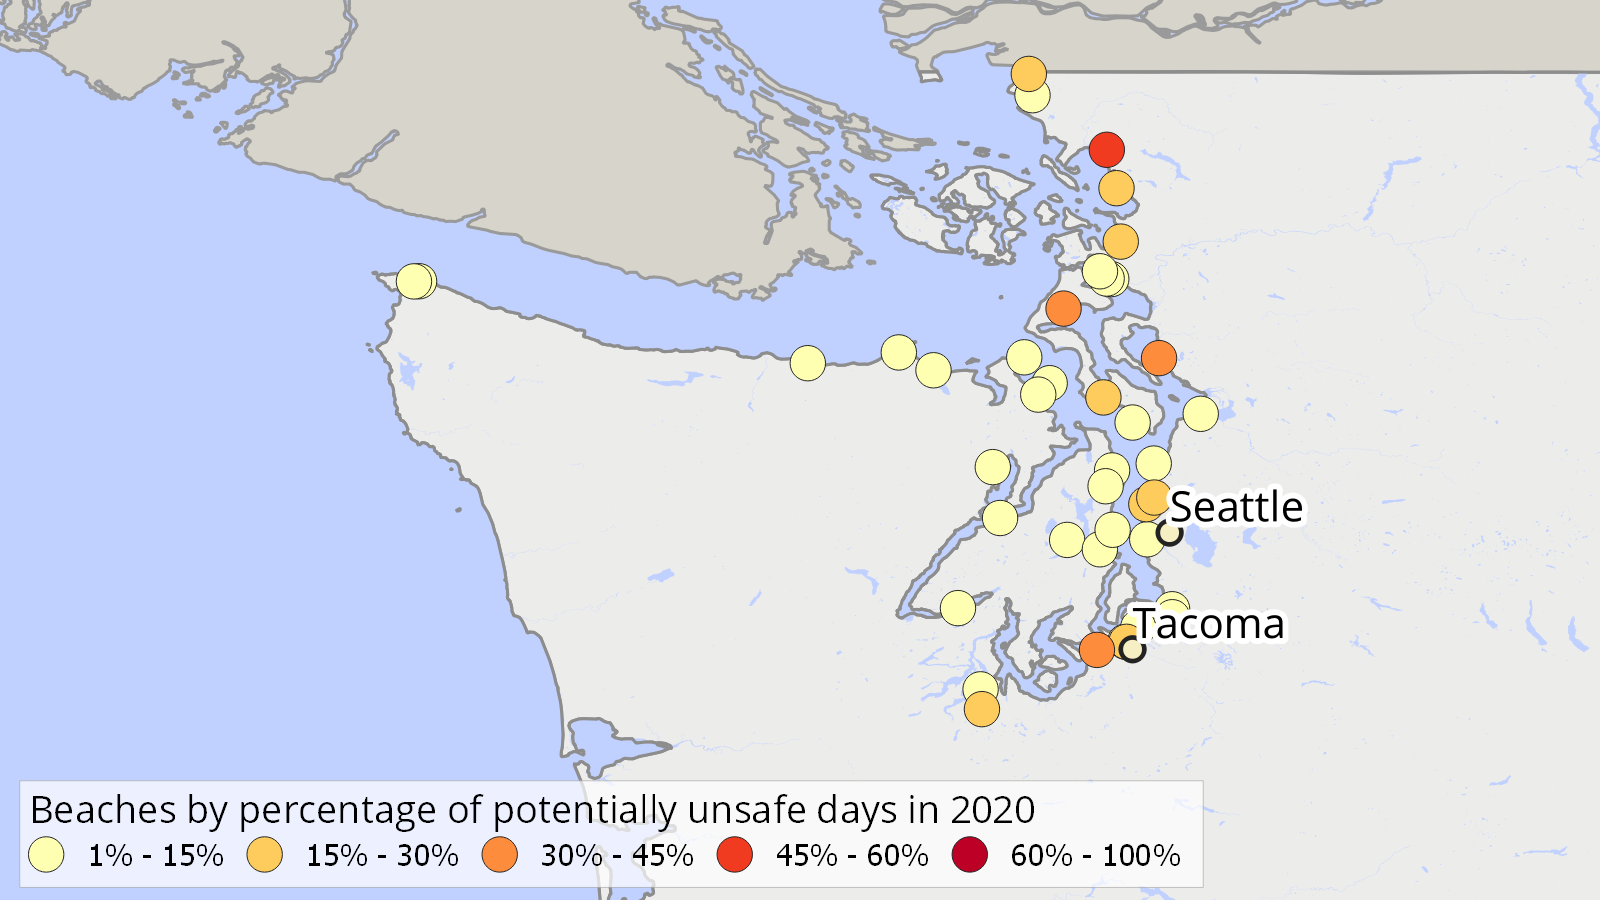
| Beach name | County | Potentially unsafe days in 2020 | Days with testing | Percentage of testing days with potentially unsafe water |
|---|---|---|---|---|
| Little Squalicum Park* | Whatcom County | 8 | 14 | 57% |
| Kayak Point County Park* | Snohomish County | 5 | 14 | 36% |
| Titlow Park* | Pierce County | 5 | 14 | 36% |
| Windjammer Lagoon* | Island County | 5 | 14 | 36% |
| Freeland Park* | Island County | 4 | 14 | 29% |
| Wildcat Cove* | Whatcom County | 3 | 10 | 30% |
| Jack Hyde Park* | Pierce County | 3 | 14 | 21% |
| Priest Point Park* | Thurston County | 3 | 14 | 21% |
| Carkeek Park* | King County | 2 | 9 | 22% |
| Golden Gardens* | King County | 2 | 10 | 20% |
* Beach has more than one associated testing site, which may affect number of potentially unsafe days.
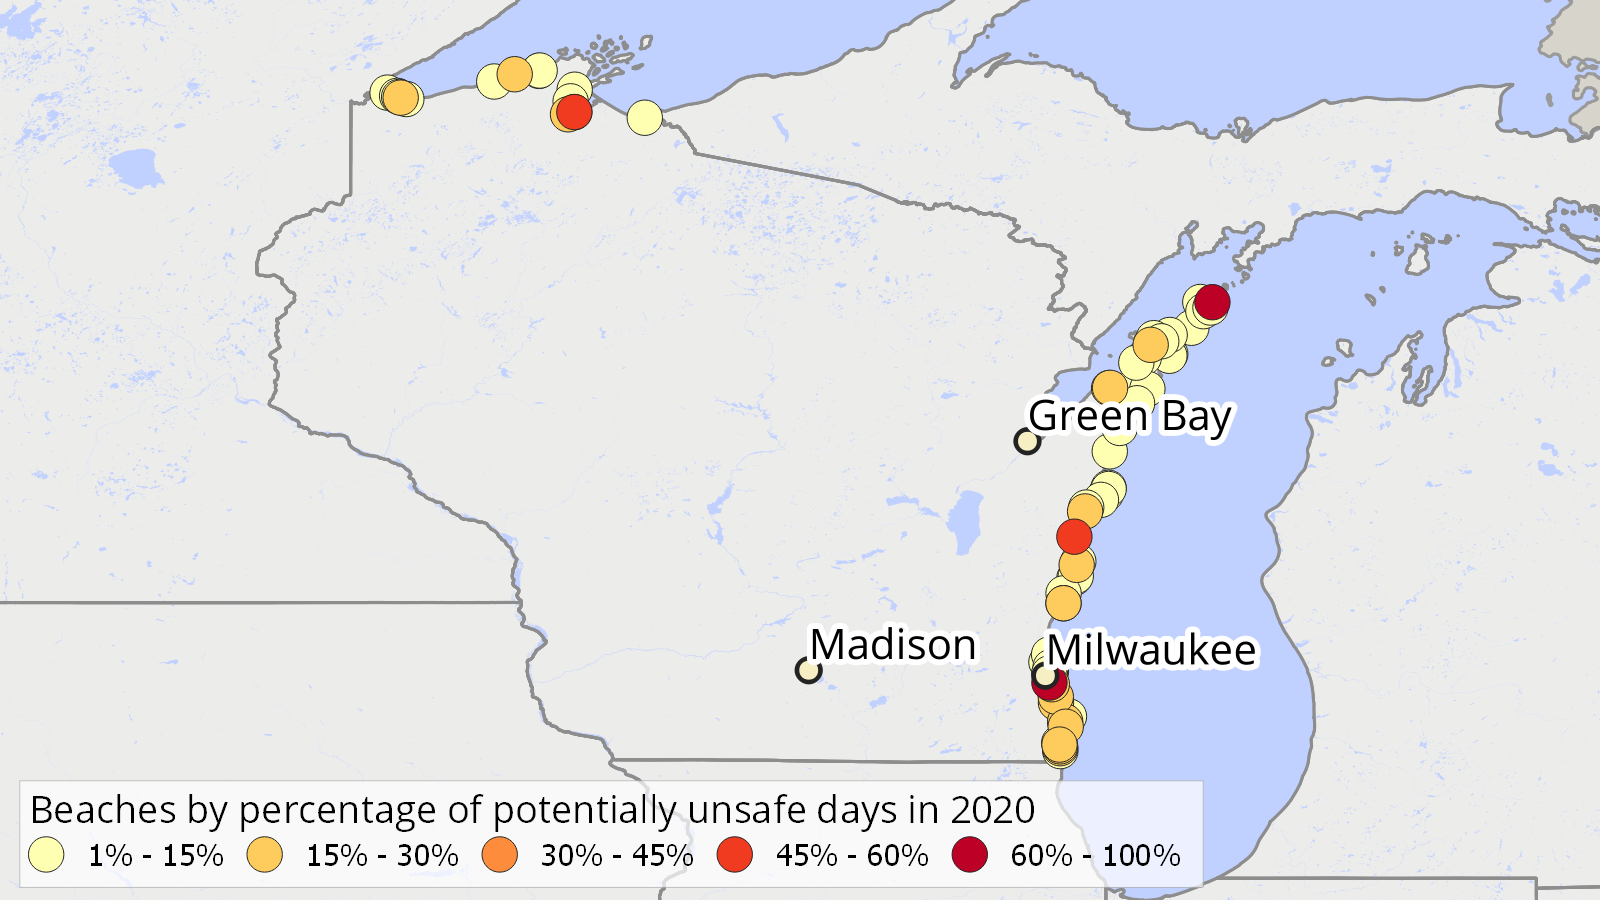
| Beach name | County | Potentially unsafe days in 2020 | Days with testing | Percentage of testing days with potentially unsafe water |
|---|---|---|---|---|
| South Shore Beach | Milwaukee County | 30 | 40 | 75% |
| Kreher Park Beach | Ashland County | 15 | 30 | 50% |
| Fish Creek Beach | Door County | 13 | 65 | 20% |
| Zoo Beach* | Racine County | 12 | 68 | 18% |
| Pennoyer Park Beach | Kenosha County | 10 | 34 | 29% |
| Red Arrow Park Beach Manitowoc | Manitowoc County | 9 | 50 | 18% |
| Simmons Island Beach | Kenosha County | 8 | 42 | 19% |
| North Beach* | Racine County | 8 | 67 | 12% |
| Hika Park Bay | Manitowoc County | 7 | 15 | 47% |
| 6th Ave. W. Beach | Ashland County | 7 | 30 | 23% |
| Maslowski Beaches* | Ashland County | 7 | 30 | 23% |
* Beach has more than one associated testing site, which may affect number of potentially unsafe days.
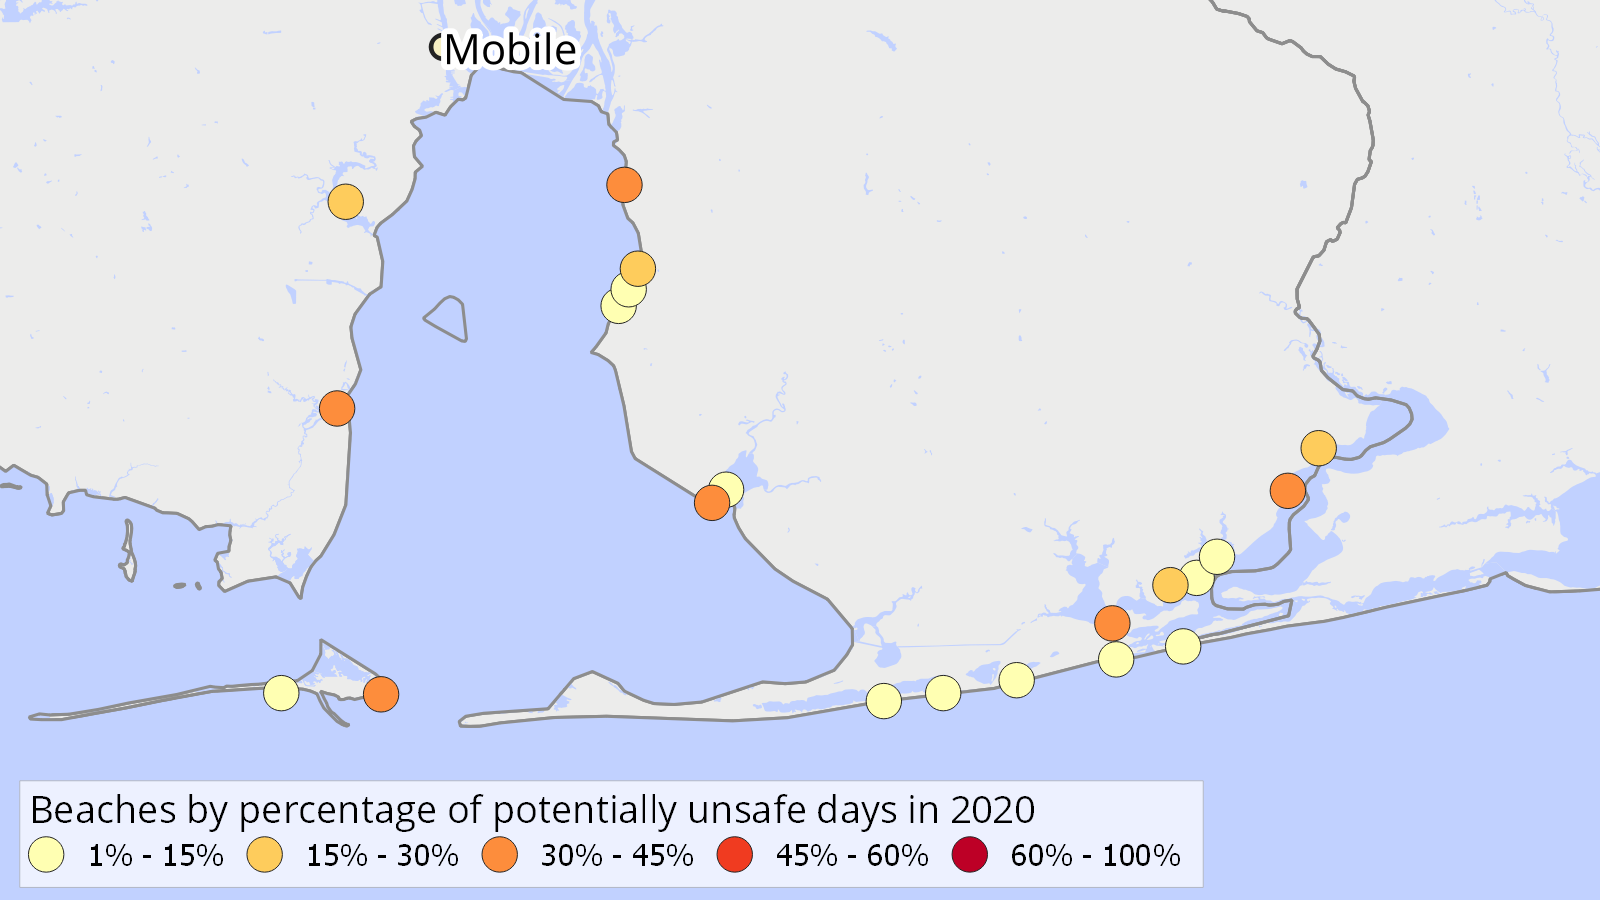
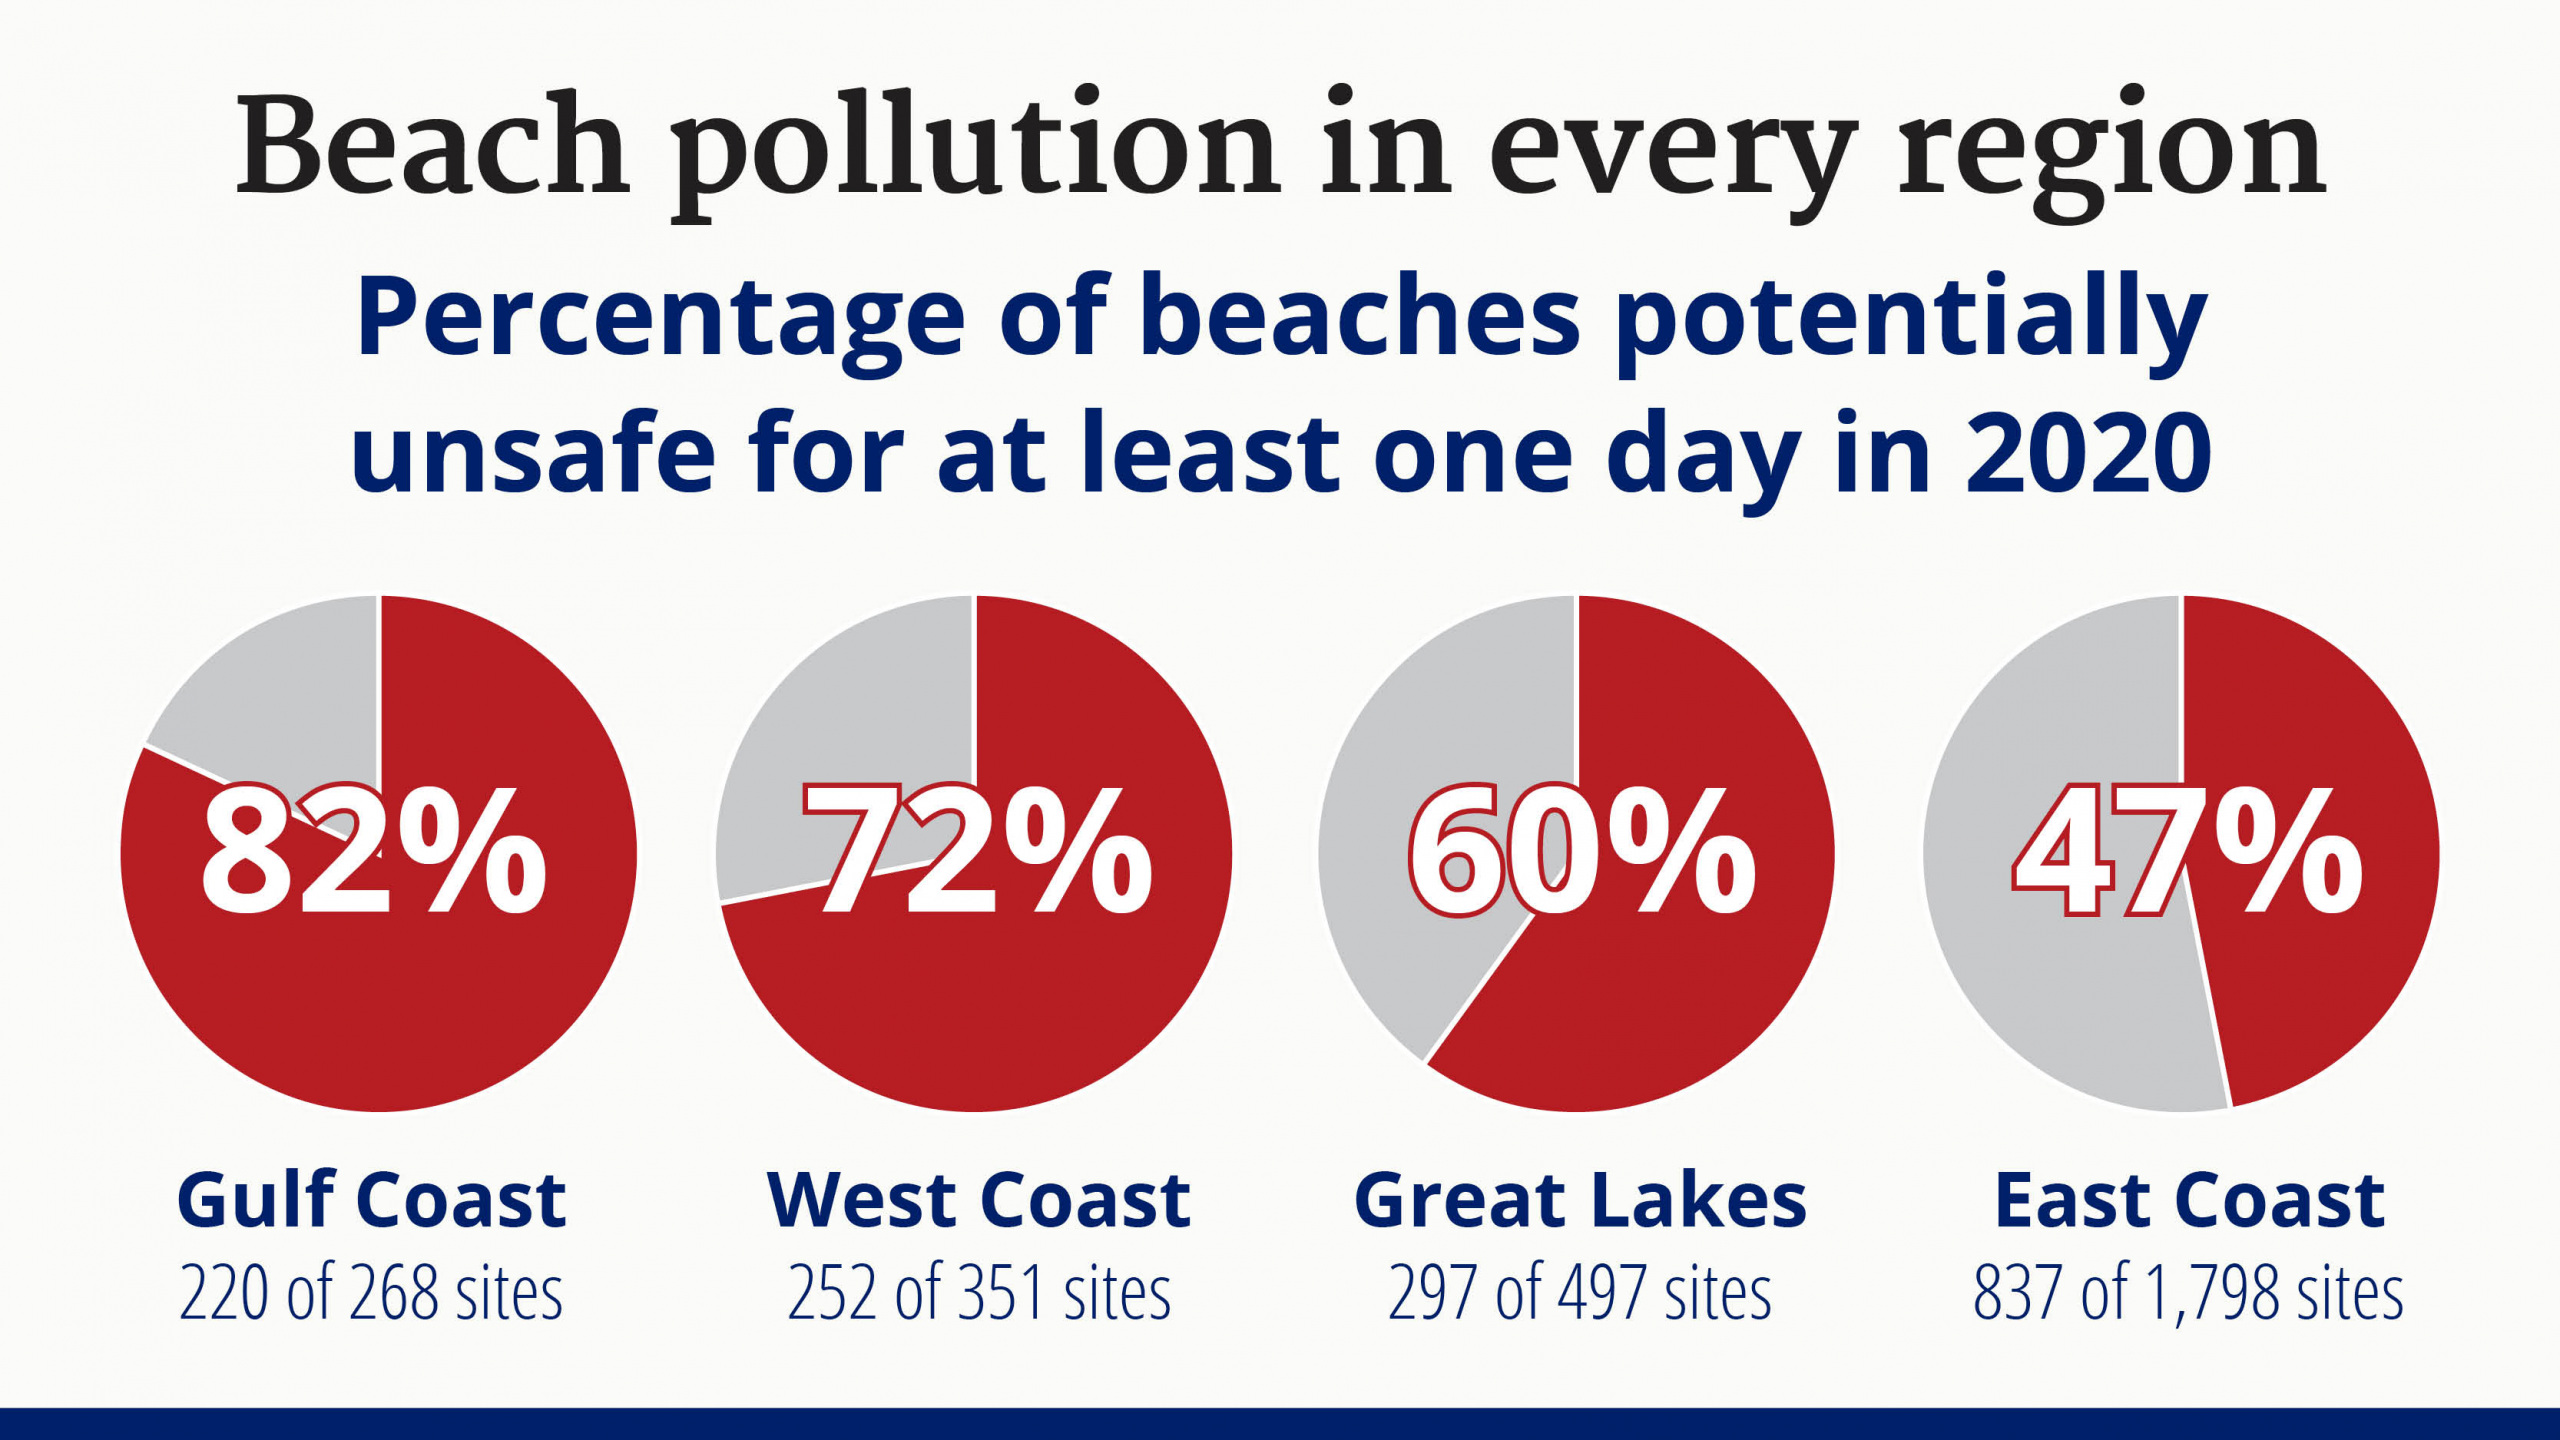
Our analysis of fecal indicator bacteria sampled data from beaches in 29 coastal and Great Lakes states and Puerto Rico finds that, in 2020:
- The water at 328 beaches – more than 1 in every 10 beaches surveyed – was potentially unsafe on at least 25 percent of the days that sampling took place.
- More than half of all the 3,166 beaches reviewed were potentially unsafe for swimming on at least one day tested.
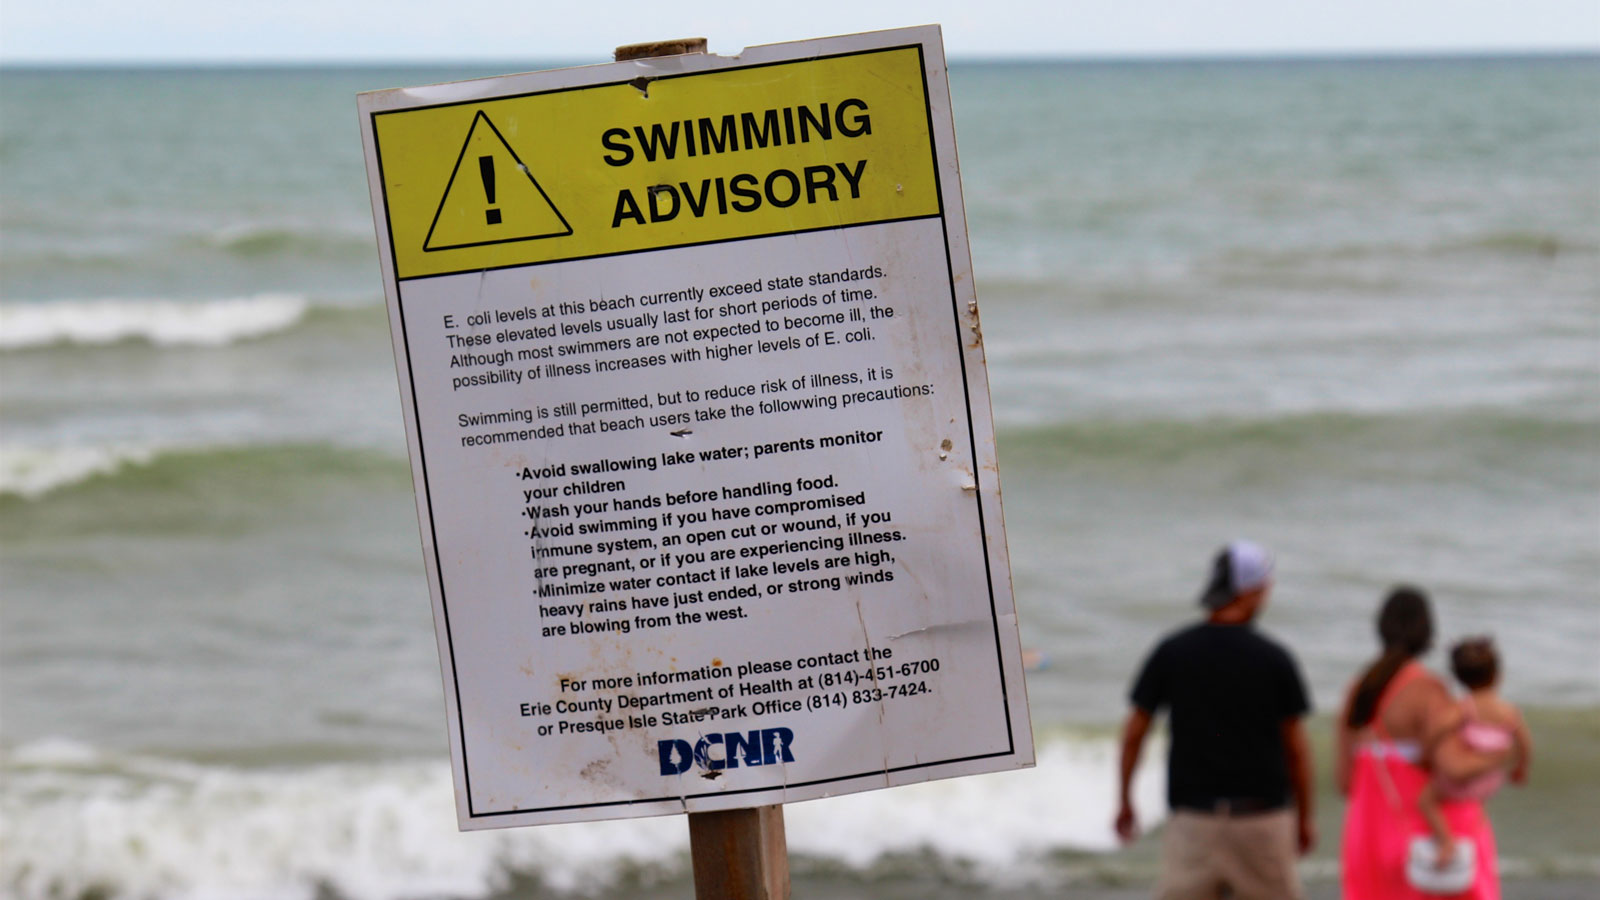
NOTE: Beaches were considered potentially unsafe if fecal indicator bacteria levels exceeded the U.S. Environmental Protection Agency’s “Beach Action Value” associated with an estimated illness rate of 32 out of every 1,000 swimmers. Many states use other thresholds for beach closure and advisory decisions, and therefore results presented here may differ from state reports on beach water quality.
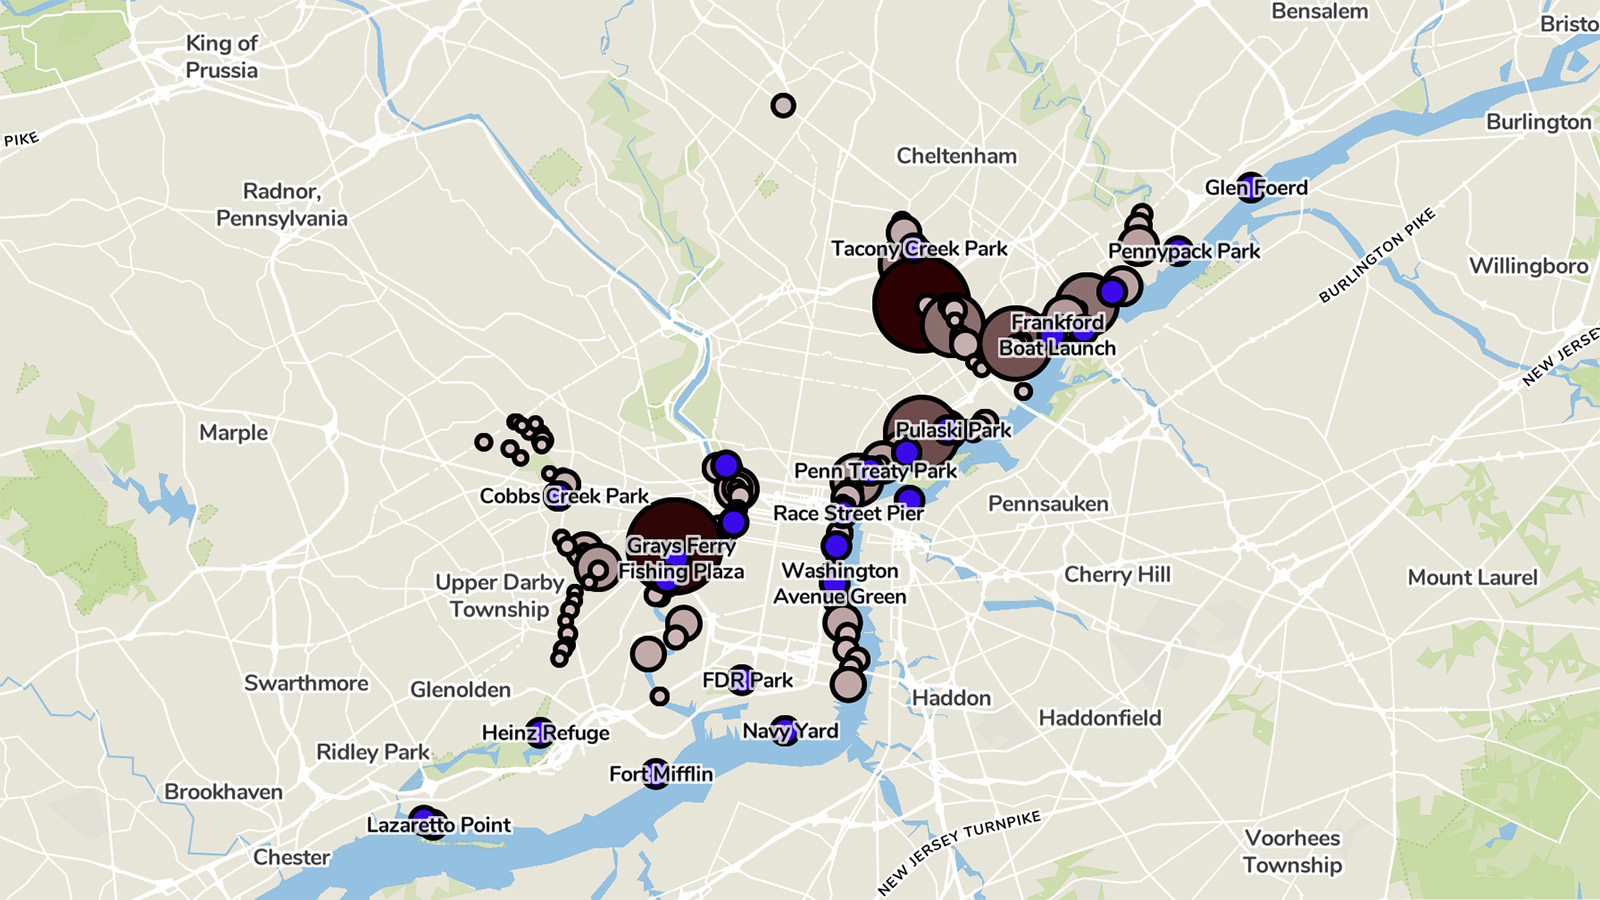
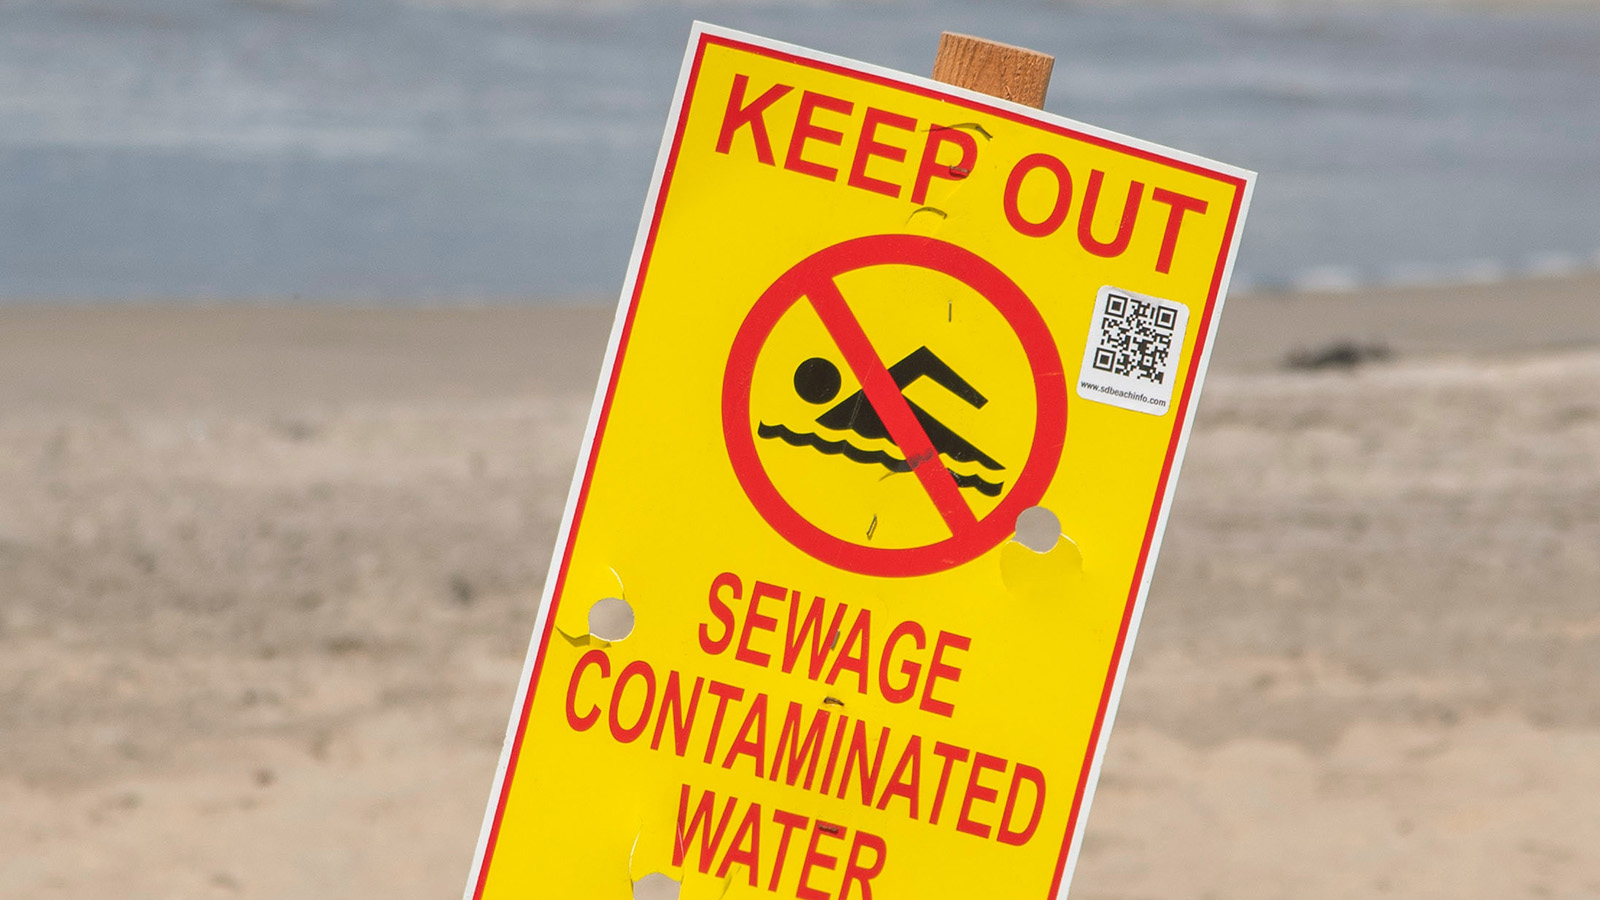
Primary sources of fecal contamination include sewage overflows and runoff pollution.
To curb this contamination and help make our beaches safe for swimming, policymakers should invest in improving our water infrastructure, especially by deploying nature-based solutions to prevent runoff pollution.
Fecal contamination makes beaches unsafe for swimming. Each year, people suffer an estimated 57 million illnesses — including nausea, diarrhea, ear infections, and rashes — from swimming in U.S. waters.
Our beaches are at risk. Runoff from paved surfaces, overflows from aging sewage systems, and manure from industrial livestock operations all threaten the waters where Americans swim. These pollution threats are getting worse with climate change, as more extreme precipitation events bring heavy flows of stormwater.
- Sprawling development has created more impervious surfaces that cause runoff pollution and has destroyed natural areas such as wetlands that protect beaches from contamination. From 1996 to 2016, U.S. coastal regions added 4.2 million acres of development, while losing 640,000 acres of wetland and nearly 10 million acres of forest.
- America’s sewage infrastructure is deteriorating and outdated. Many communities, particularly around the Great Lakes, still use combined sewers that were designed to discharge sewage directly to waterways during heavy rainfall. Sanitary sewers, which are designed to carry sewage alone, can also spill dangerous sewage if they are not properly maintained — and they overflow as many as 75,000 times each year in the U.S.
- The rise of factory farms has resulted in large concentrations of livestock manure that cannot be stored safely and is often overapplied to crops. All too often, rainfall washes excess manure from cropland into our waterways, where it can put swimmers’ health at risk. Animal manure can also contain pathogens that are resistant to antibiotics, creating added risk to public health.
Of more than 3,000 beaches sampled for bacteria across the country in 2020, 328 were potentially unsafe for swimming on at least 25 percent of days that testing took place.
- As of May 2021, sampling data for 2020 from 3,166 beaches in 29 coastal and Great Lakes states and Puerto Rico was available through the National Water Quality Monitoring Council’s Water Quality Portal.
- Of those beaches, 1,689 (53 percent) had bacteria levels indicating potentially unsafe levels of fecal contamination for swimming on at least one day, and 328 were potentially unsafe on at least 25 percent of the days that sampling took place.
- Swimmers could also be at risk at additional beaches where no bacterial testing was conducted or available through the Water Quality Portal.
In every coastal and Great Lakes state and in Puerto Rico, sampling revealed potentially unsafe levels of contamination in 2020.
Our recommendations
To ensure that all of our beaches are safe for swimming, policymakers should work to protect beaches from runoff and sewage pollution – including by stopping pollution at its source, and by protecting natural areas. Solutions include:
- Dramatically increasing funding to fix sewage systems and prevent runoff pollution through natural and green infrastructure, including rain gardens, permeable pavement and green roofs.
- Protecting wetlands, which filter out pollutants like bacteria, and streams, which flow to coastal areas where people swim.
- Enacting moratoriums on new or expanded industrial-scale livestock operations, particularly in areas where these operations would threaten our beaches and other waterways.
Policymakers should also ensure that swimmers are presented with the best possible information to make decisions regarding their health. Officials should expand funding for beach testing to ensure adequate testing at all beaches. States should use the EPA’s most protective “Beach Action Value” bacteria standard for making beach advisory decisions and should work to implement same-day bacteria testing and warning systems.
Topics
Authors
Gideon Weissman
Former Policy Analyst, Frontier Group
Find Out More
Good intentions, bad outcomes. Six ways impervious surfaces harm our cities and the environment