
Together, ten industrial facilities in Allegheny County emitted a total of more than 1.4 million pounds of toxic pollutants to Allegheny County’s air in 2021 – including substances linked to cancer, birth defects, reproductive problems and other ailments. It’s time for the Allegheny County Health Department (ACHD) to protect the health of Pittsburgh-area residents by taking common sense steps to clean up the county’s most-toxic industrial air polluters – the “Toxic Ten.”
Explore the facts about the 10 facilities emitting the most-toxic air pollution in Allegheny County.
The Pittsburgh area has some of the worst air quality in the nation. In 2022, residents of Allegheny County endured 179 days with elevated levels of ozone “smog” and/or particulate pollution. In 2022, the American Lung Association gave Allegheny County’s air a grade of “F” based on the number of days with excessive levels of ozone and particulates in the county’s air from 2018 through 2020.1
Emissions of toxic air pollutants – pollutants linked to cancer, reproductive or developmental harm, or other serious health effects – also contribute to Allegheny County’s poor air quality. Allegheny County ranked in the top 2% of counties nationwide for added cancer risk from air toxics emissions from stationary sources such as industrial facilities in 2019.
Facilities in certain industries that use or release toxic chemicals to the environment are required to report those releases to the U.S. EPA’s Toxics Release Inventory (TRI). In 2021, 46 industrial facilities in Allegheny County reported releases of toxic chemicals to air to the TRI. Those reported emissions totaled more than 1.8 million pounds.
Of those 46 facilities, just 10 active facilities – the “Toxic Ten” – were responsible for nearly four-fifths of that pollution, or more than 1.4 million pounds of toxic pollutants released to the air.
Among the pollutants released by the Toxic Ten are toxics linked to serious health effects, including benzene (linked to cancer, developmental and reproductive problems), lead (a powerful neurotoxicant), chromium (a variety of which poses risk of cancer and other health harms), and hydrogen sulfide (which smells of “rotten eggs” and can harm the respiratory and nervous systems).
The “Toxic Ten” facilities highlighted on this website represent those active facilities whose emissions in 2021 posed the greatest toxic hazard, estimated by applying toxicity weighting factors developed for the U.S. EPA’s Risk Screening Environmental Indicators (RSEI) Hazard metric to each facility’s reported toxic releases. (See methodology for more.)
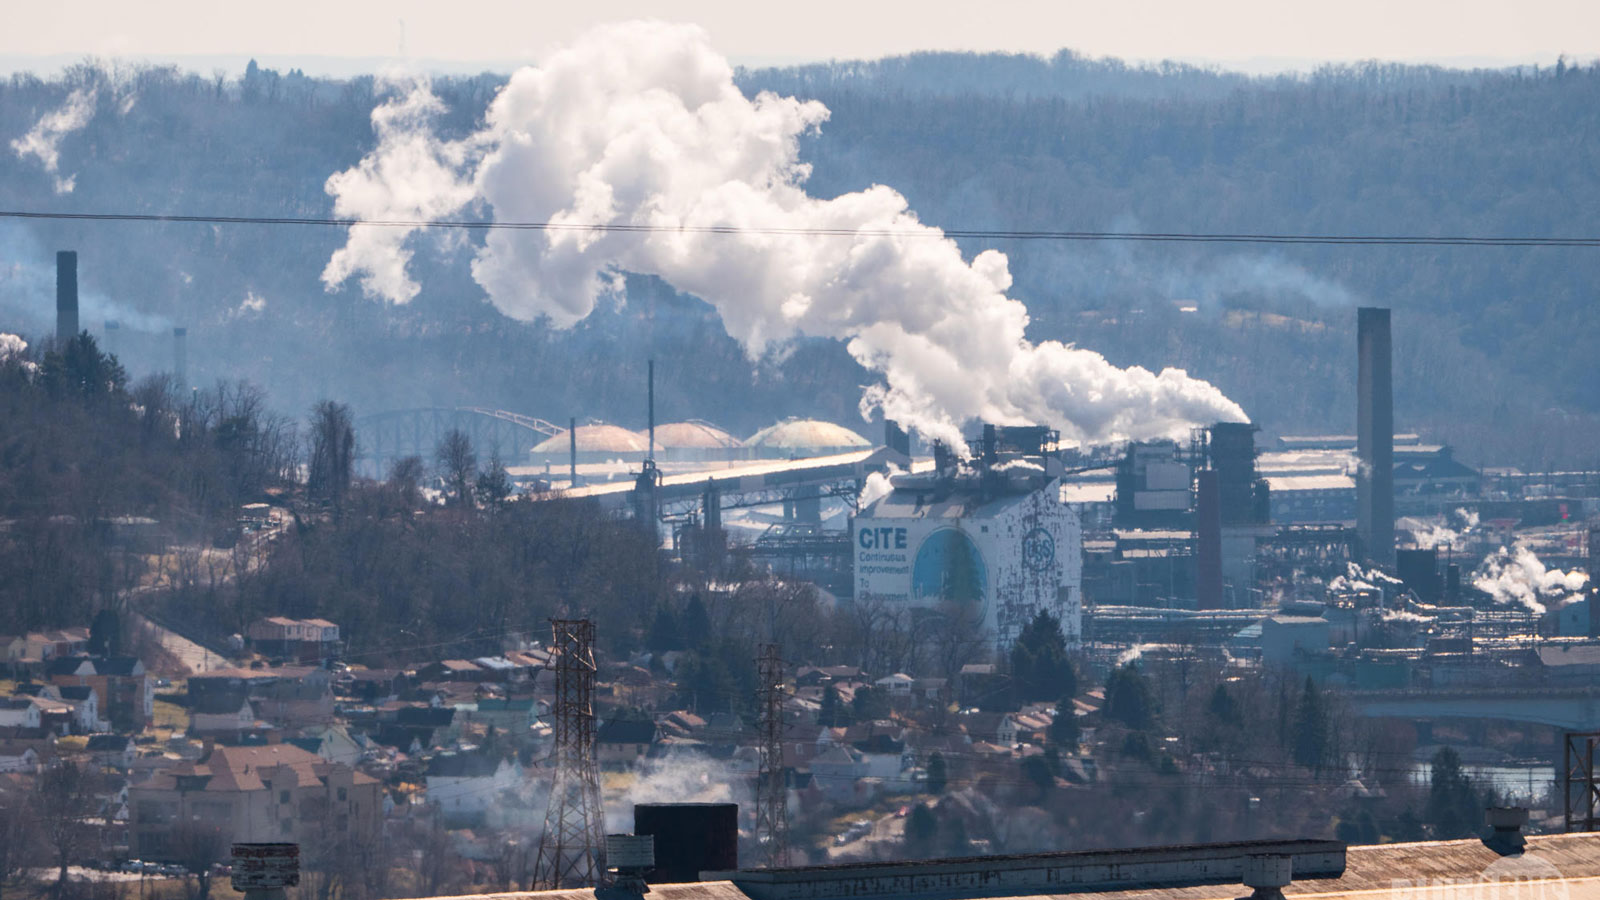
U.S. Steel’s Clairton coke plant replaced ATI Flat Rolled Products (2019’s leader) as the most-toxic industrial air polluter in Allegheny County in 2021 based on the toxicity of its emissions to the air. The Clairton plant reported releasing more than 1.1 million pounds of toxics to the county’s air in 2021, roughly 60% of all air toxics releases reported by industrial facilities in the county by weight. The facility’s releases accounted for 23% of the toxic hazard posed by industrial air toxics emissions in the county in 2021.
The Cheswick Power Plant (which closed in early 2022), Carpenter Powder Products and Harsco Metals’ Natrona Facility (which did not report toxic air emissions to the EPA in 2021) appeared on the Toxic Ten list for their emissions in 2019 but are not on the 2021 list. (See note in the Methodology below related to Harsco.) TMS International in Braddock, Neville Chemical on Neville Island and the McConway & Torley foundry in Pittsburgh took their place in the Toxic Ten in 2021.
Top 10 most-toxic active industrial facilities in Allegheny County reporting air pollution to TRI in 2021, by facility and hazard-based toxicity result:
* Blank fields indicate that toxicity weighting information for this chemical is unavailable. See methodology.
* Blank fields indicate that toxicity weighting information for this chemical is unavailable. See methodology.
Some releases round to zero.
Some releases round to zero.
The listing of the 10 Allegheny County active industrial facilities with the “most toxic” air emissions in 2021 is based on the facilities’ releases to air of toxic substances as reported to the U.S. EPA’s Toxics Release Inventory (TRI), adjusted to account for the relative toxicity of those releases using hazard weighting factors developed for the EPA’s Risk Screening Environmental Indicators (RSEI) model.
The ranking of Allegheny County’s “Toxic Ten” reflects only those releases reported to TRI. TRI reporting does not capture all releases of hazardous substances from all facilities. Specifically, this analysis under-represents or omits four categories of toxic air releases:
Despite these limitations, TRI remains the most comprehensive source of data available detailing specific toxic releases from industrial facilities to the air.
Data from the TRI 2021 National Analysis were downloaded via the Envirofacts TRI Form R & A Download page at https://enviro.epa.gov/facts/tri/form_ra_download.html on 1 November 2022. Only facilities with non-zero values for “air total releases” with locations in Allegheny County were included in this analysis.
Reporting facilities are able to amend their TRI reporting on a continuous basis. The National Analysis data used in this analysis was “frozen” in October 2022 and does not include revisions made by facilities after that date. As a result, the figures cited in this analysis may not match data currently available on some pages of the EPA web site.
The industry categories used in this analysis were obtained by matching the North American Industry Classification System (NAICS) codes available in the TRI data download with 2017 NAICS code definitions from the U.S. Census Bureau, downloaded 16 May 2022 from https://www.census.gov/naics/?48967.
The EPA’s Risk Screening Environmental Indicators (RSEI) provide toxicity-weighted measures with which to assess the level of potential hazard or risk to public health posed by chemical releases reported under the TRI. In this analysis, we used toxicity weights used to produce the EPA’s “RSEI Hazard” metric to compare the toxicity of air releases from facilities in Allegheny County. The RSEI Hazard metric provides a screening-level indicator useful for comparing releases but does not account for potential routes of human exposure to toxics released by industrial facilities.
EPA had not yet released RSEI Hazard data for the 2021 TRI reporting year as of the date of this analysis. We calculated Hazard-based results for each facility, following EPA methodologies and using the EPA’s RSEI Toxicity Weighting Spreadsheet v.2.3.10, downloaded from https://www.epa.gov/rsei/rsei-documentation-and-help, 1 November 2022. In most cases, Hazard-based results were calculated by multiplying the facility’s release of a particular chemical in pounds by the inhalation toxicity weight (ITW) of that chemical.
In two cases, calculation of the Hazard-based result required an additional step:
To calculate the Hazard-based result for each facility, we multiplied the reported air releases of chromium and chromium compounds (in pounds) by the percentage of each facility’s releases made up of chromium (VI). Each facility’s chromium VI percentage was derived from industry-specific factors obtained in the U.S. EPA’s TRI-based Chromium Speciation Excel spreadsheet, downloaded from https://gaftp.epa.gov/air/nei/2017/doc/supporting_data/TRI_based_chromium_speciation.zip , 7November 2022. Each facility’s primary NAICS code was used to identify the appropriate chromium speciation profile for each facility. The percentage of chromium VI in that profile was then multiplied by the facility’s reported releases of chromium and chromium compounds to obtain an adjusted release figure, which could then by multiplied by the appropriate RSEI toxicity weight. Facilities without an industry-specific profile were assigned the default value of 34% chromium VI, as described in the EPA’s RSEI Methodology.5
EPA’s RSEI Toxicity Weighting Spreadsheet does not include a weighting factor for every chemical with releases reported under the TRI. Consistent with EPA methodology, those releases are not assigned a RSEI Hazard value and do not count toward a facility’s ranking.6
Each toxic substance reported as released by a facility was evaluated to determine if it was associated with cancer, developmental harm or reproductive toxicity. The assessment of the health effects of the substances is based on analysis conducted for the Environment America Research & Policy Center report, Wasting Our Waterways, published in September 2022, updated to include substances released to air by Allegheny County polluters that were not included in that report. 7
The information used to assign health effects to toxic releases was primarily obtained from two datasets. The first was the EPA’s TRI Toxics Tracker tool at https://edap.epa.gov/public/extensions/ TRIToxicsTracker/TRIToxicsTracker.html, downloaded on 10 May 2022. We used the “Potential Health Effects” option under the “Chemicals” tab and selected all reporting years in the filter options. The other dataset was California’s Proposition 65 list of known harmful chemicals and their effects, downloaded on 9 May 2022 at https://oehha.ca.gov/proposition-65/proposition-65-list (and reviewed for updates on 21 February 2023) Health effects for chemicals indicated in the “Prop 65” list as having been “delisted” or for which a given health effect was “removed” were excluded from the dataset. The following rules were followed in assigning health effects to toxic substances:
In some cases, groups of chemicals or individual chemicals were listed with associated health effects in the Prop 65 list but with no corresponding Chemical Abstracts Service (CAS) number. In these cases, CAS numbers were obtained from the EPA’s listing of TRI chemicals or obtained from other sources and assigned as described in the footnote.9
The Cheswick power plant ranked eighth for toxicity of its air releases in 2021. However, the facility closed in the spring of 2022 and was therefore excluded from the Toxic Ten list. McConway & Torley, which had ranked 11th for toxic air releases in 2021, was then included in the Toxic Ten.
Harsco Metals in Natrona Heights has appeared in all previous editions of the Toxic Ten, ranking second for the toxicity of its releases to Allegheny County’s air in 2019. The facility, which processes steel slag from the neighboring ATI Flat Rolled Products plant, released compounds of chromium, lead, manganese and nickel to the region’s air in 2019 and 2020, but as of the time of publication of this website, had not reported toxic releases for 2021 to the EPA’s Toxics Release Inventory. It is unknown whether Harsco is no longer required to report to TRI (for example, by reducing its use or releases of toxic substances below reporting thresholds) or has simply failed to report. The company’s 2020 releases would have ranked it among the Toxic Ten in this report.
The population within three miles of each facility was obtained from the U.S. EPA, which calculates this figure for each facility in its Enforcement and Compliance History Online (ECHO) database.
The number of schools and hospitals within three miles of each facility was determined via GIS analysis. A shapefile with the locations of hospitals in the commonwealth was obtained from the Pennsylvania Department of Health via Pennsylvania Spatial Data Access on 29 December 2022. A listing of public and public charter schools in Allegheny County was obtained from the Pennsylvania Department of Education, Educational Names & Addresses (EdNA) database on 29 December 2022. The addresses from the EdNA database were geocoded using the U.S. Census Bureau’s public batch geocoding tool, with schools that did not produce matches then manually geocoded using Google Maps searches. Parochial and private schools are not included in the number of schools reported for each facility.
The authors are grateful to John Graham, senior scientist at Clean Air Task Force for his review and suggestions, and to the Heinz Endowments for making this project possible.
Executive Director, PennEnvironment Research & Policy Center
As executive director, David spearheads the issue advocacy, civic engagement campaigns, and long-term organizational building for PennEnvironment. He also oversees PennPIRG and other organizations within The Public Interest Network that are engaged in social change across Pennsylvania. David’s areas of expertise include fracking, global warming, environmental enforcement and litigation, and clean energy and land use policy in Pennsylvania. David has served on the environmental transition teams for Gov. Tom Wolf and Philadelphia Mayor Jim Kenney, and been named one of Pennsylvania’s “40 under 40” environmentalists by the Pennsylvania Environmental Council. Under David’s leadership, PennEnvironment has won the two largest citizen suit penalties in Pennsylvania history against illegal polluters under the federal Clean Water Act. David lives in South Philadelphia with his family, where they’re involved in their local elementary school, community garden and civic association.
Clean Air Advocate, PennEnvironment Research & Policy Center
Zachary leads PennEnvironment’s Clean Air for Pittsburgh campaign, working with community leaders, public officials and coalition partners to curb Pittsburgh’s air pollution. Zachary has run a canvass office registering thousands of underrepresented voters, helped Pittsburghers have their voices heard on climate, and organized a statewide citizen advocacy day. Zachary lives in Pittsburgh, where he enjoys reading sci-fi novels and watching the Pittsburgh Penguins.
Associate Director and Senior Policy Analyst, Frontier Group
Tony Dutzik is associate director and senior policy analyst with Frontier Group. His research and ideas on climate, energy and transportation policy have helped shape public policy debates across the U.S., and have earned coverage in media outlets from the New York Times to National Public Radio. A former journalist, Tony lives and works in Boston.