
America produces more than three times as much power from the sun, the wind and the earth as we did in 2013, with growth in all 50 states. Key technologies such as electric vehicles and battery storage are also booming - helping to repower America with clean energy.
The Renewables on the Rise dashboard allows you to track the growth of clean energy in your state and around the country. Explore your state’s clean energy progress, then read below for more information on the rise in renewables … and what local and state governments can do to help accelerate the transition to clean energy.
How much did America’s renewable energy and clean energy technologies grow in the last 10 years? Find out more below.
America produced enough wind energy to power nearly 41 million typical homes in 2022 – 2.6 times as much wind energy as in 2013.
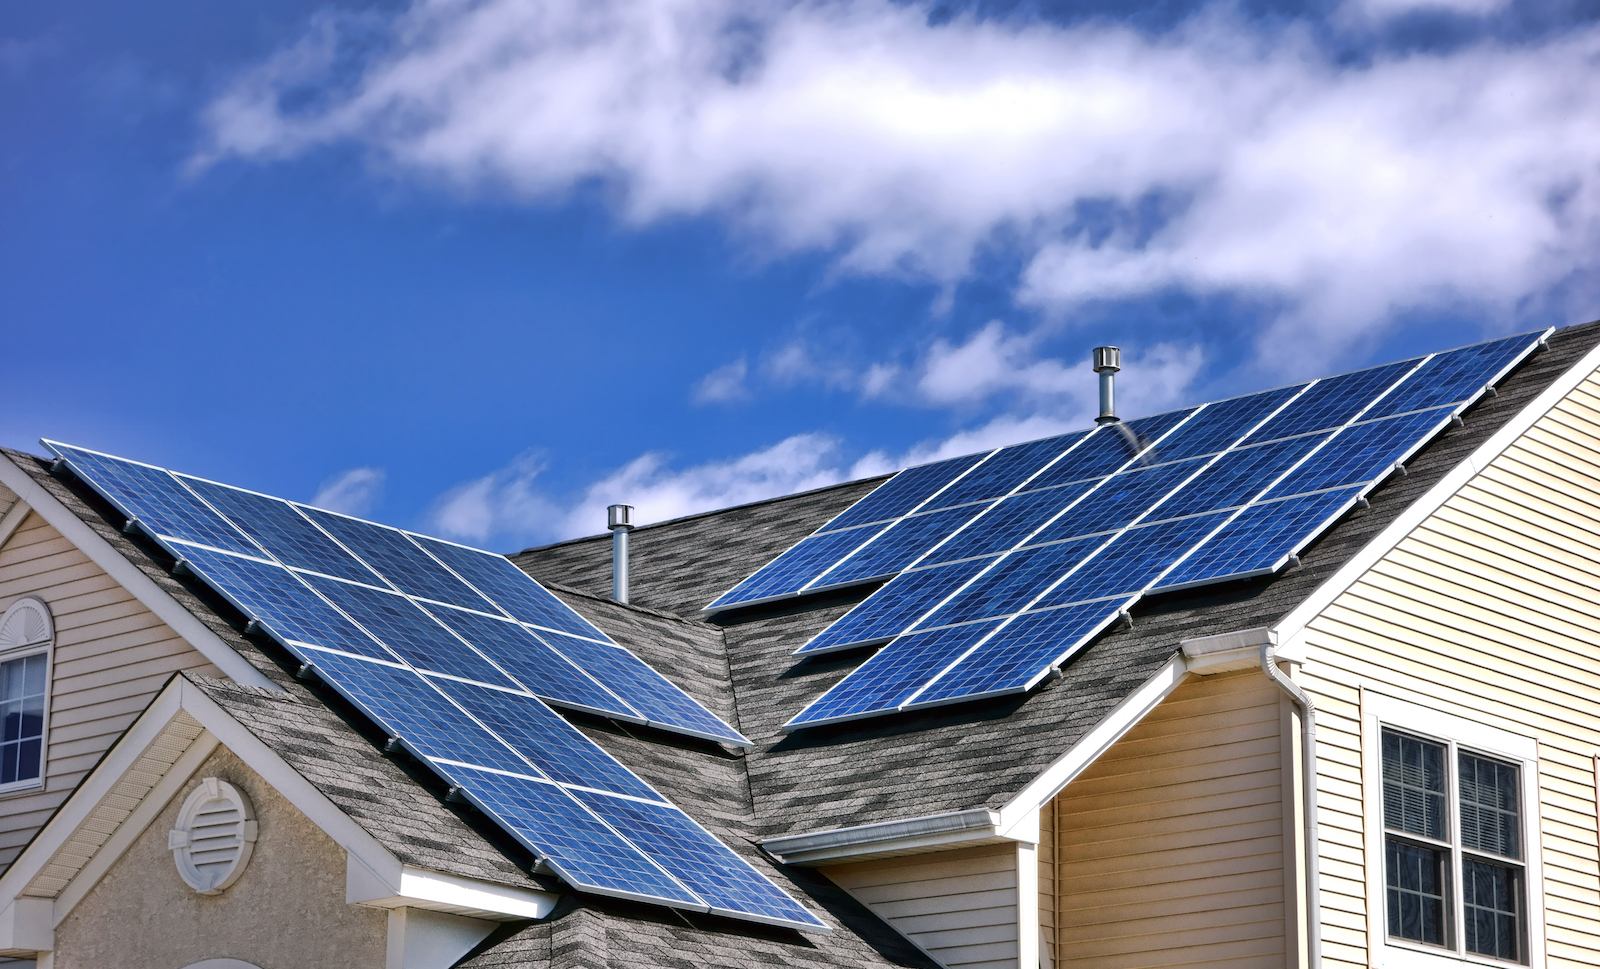
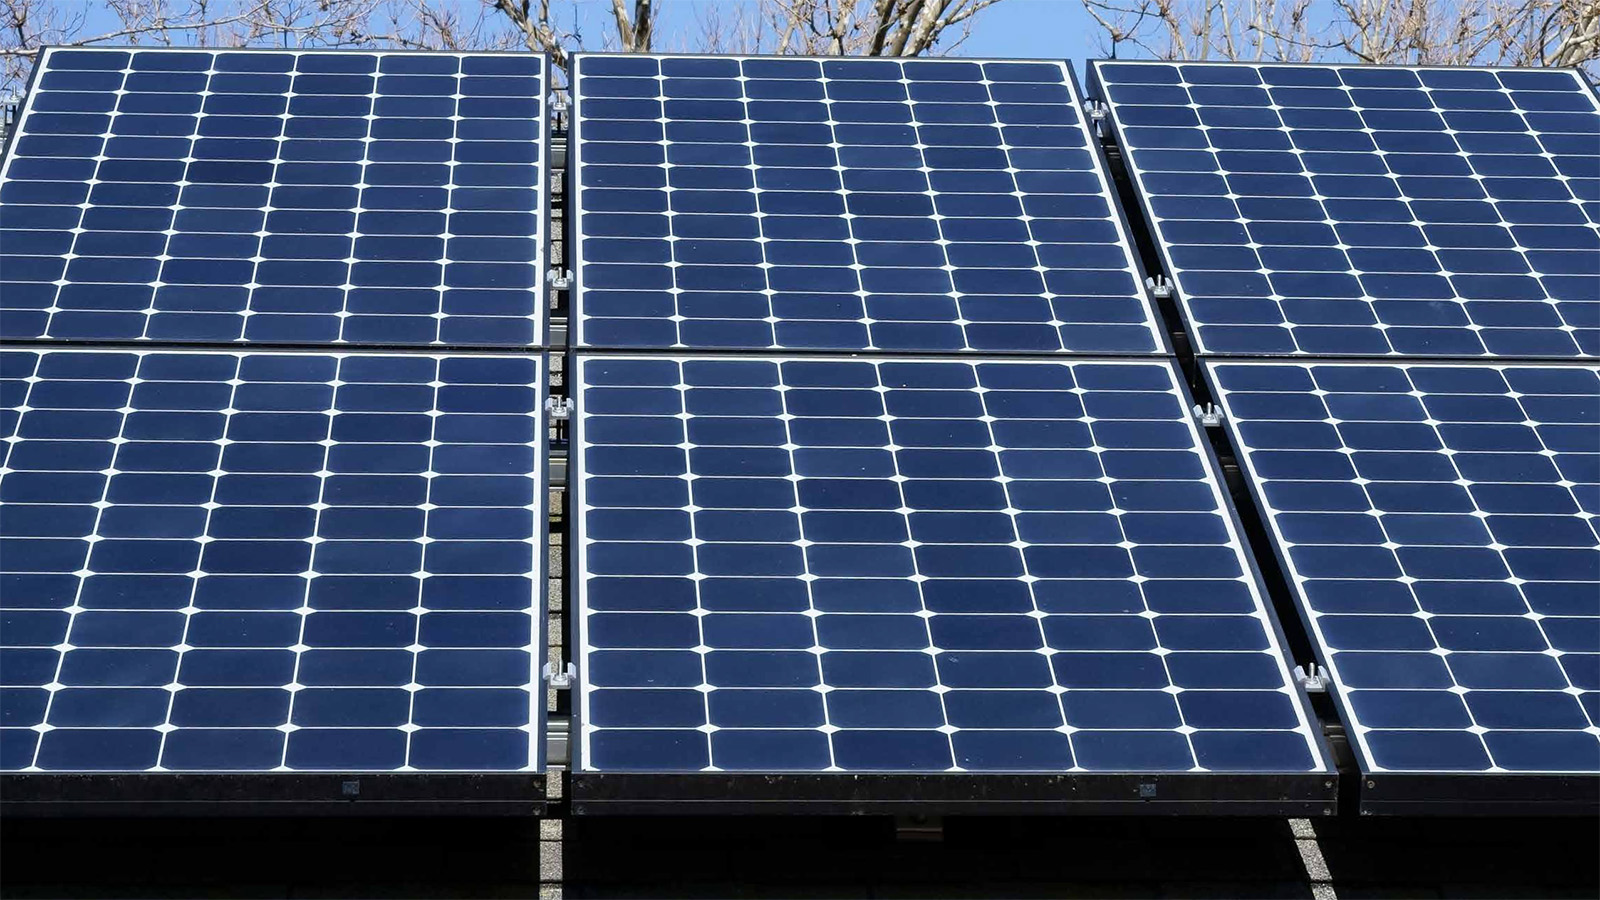
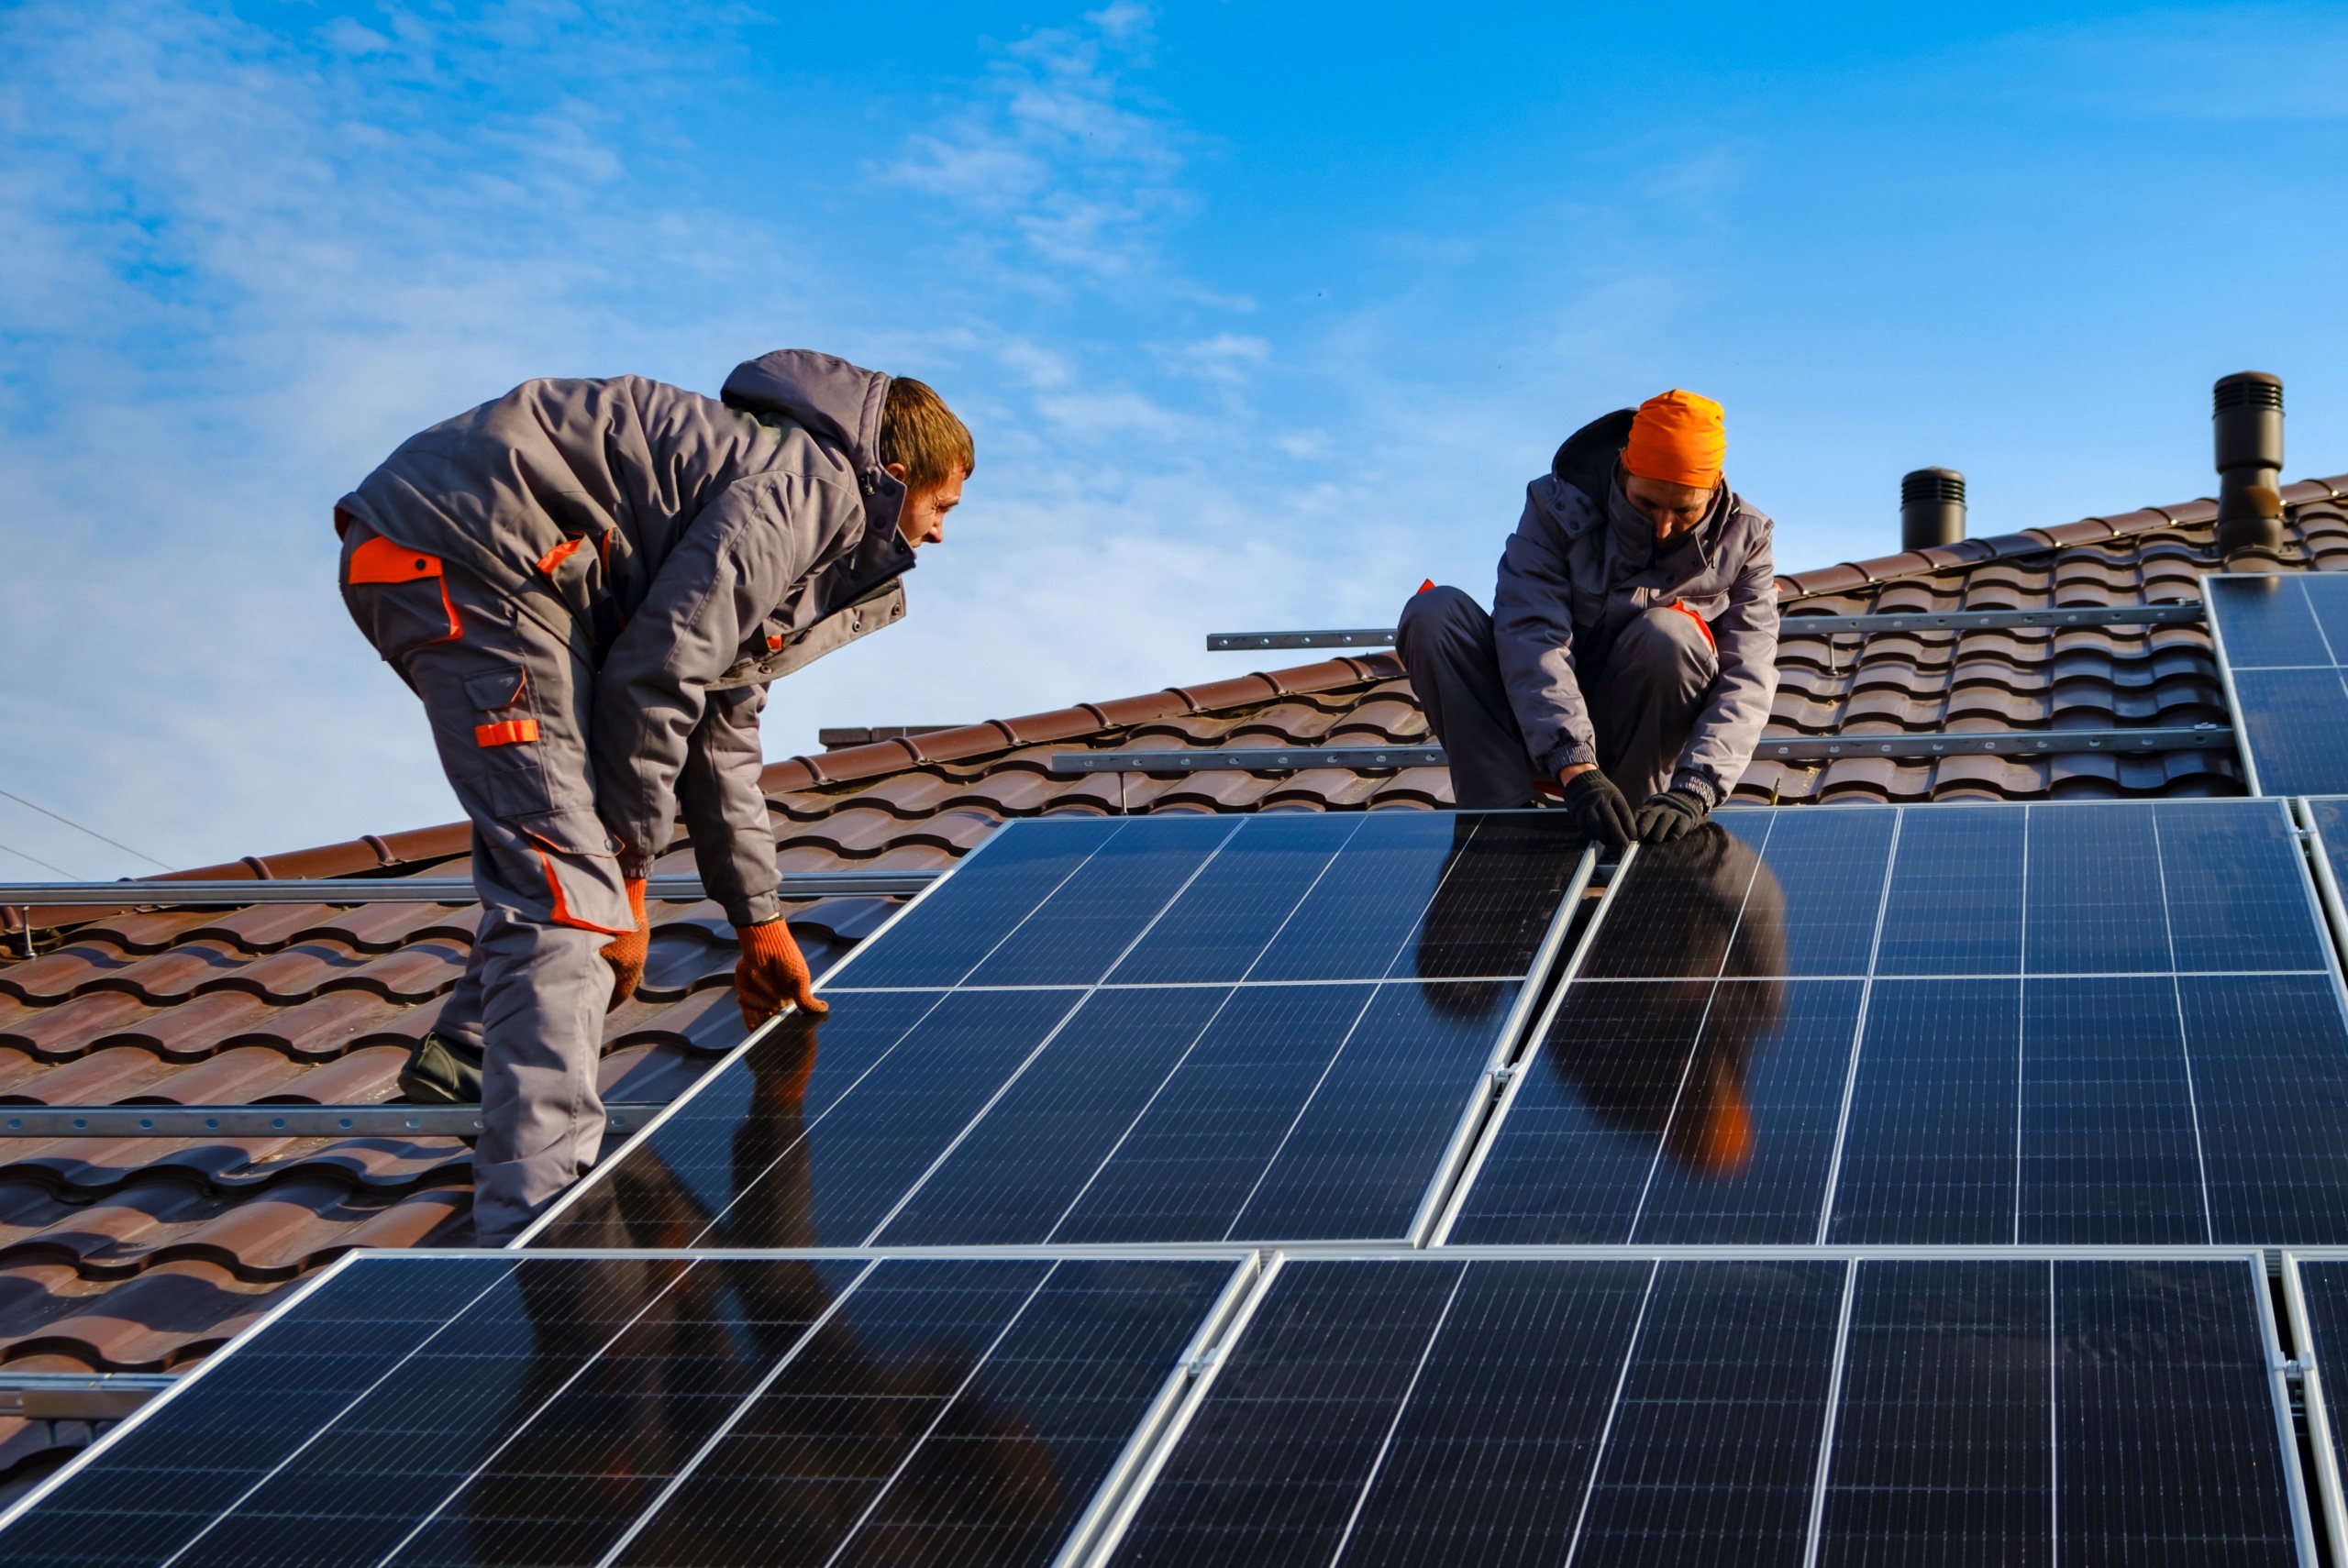
America produced enough solar energy to power 19 million homes in 2022 – nearly 12 times as much solar energy as in 2013.
America had 8.9 gigawatts of battery energy storage at the end of 2022, 60 times as much as in 2013 and 85 percent more than at the end of 2021, helping to support the use of more renewable energy and keep the lights on during extreme weather and times of grid stress.
Energy efficiency improvements installed in 2021 will save 300 terawatt-hours of power over their lifetimes – enough to power 28 million homes for a year. Energy efficiency savings increased by about 20% between 2013 and 2021, the last year for which information is available.
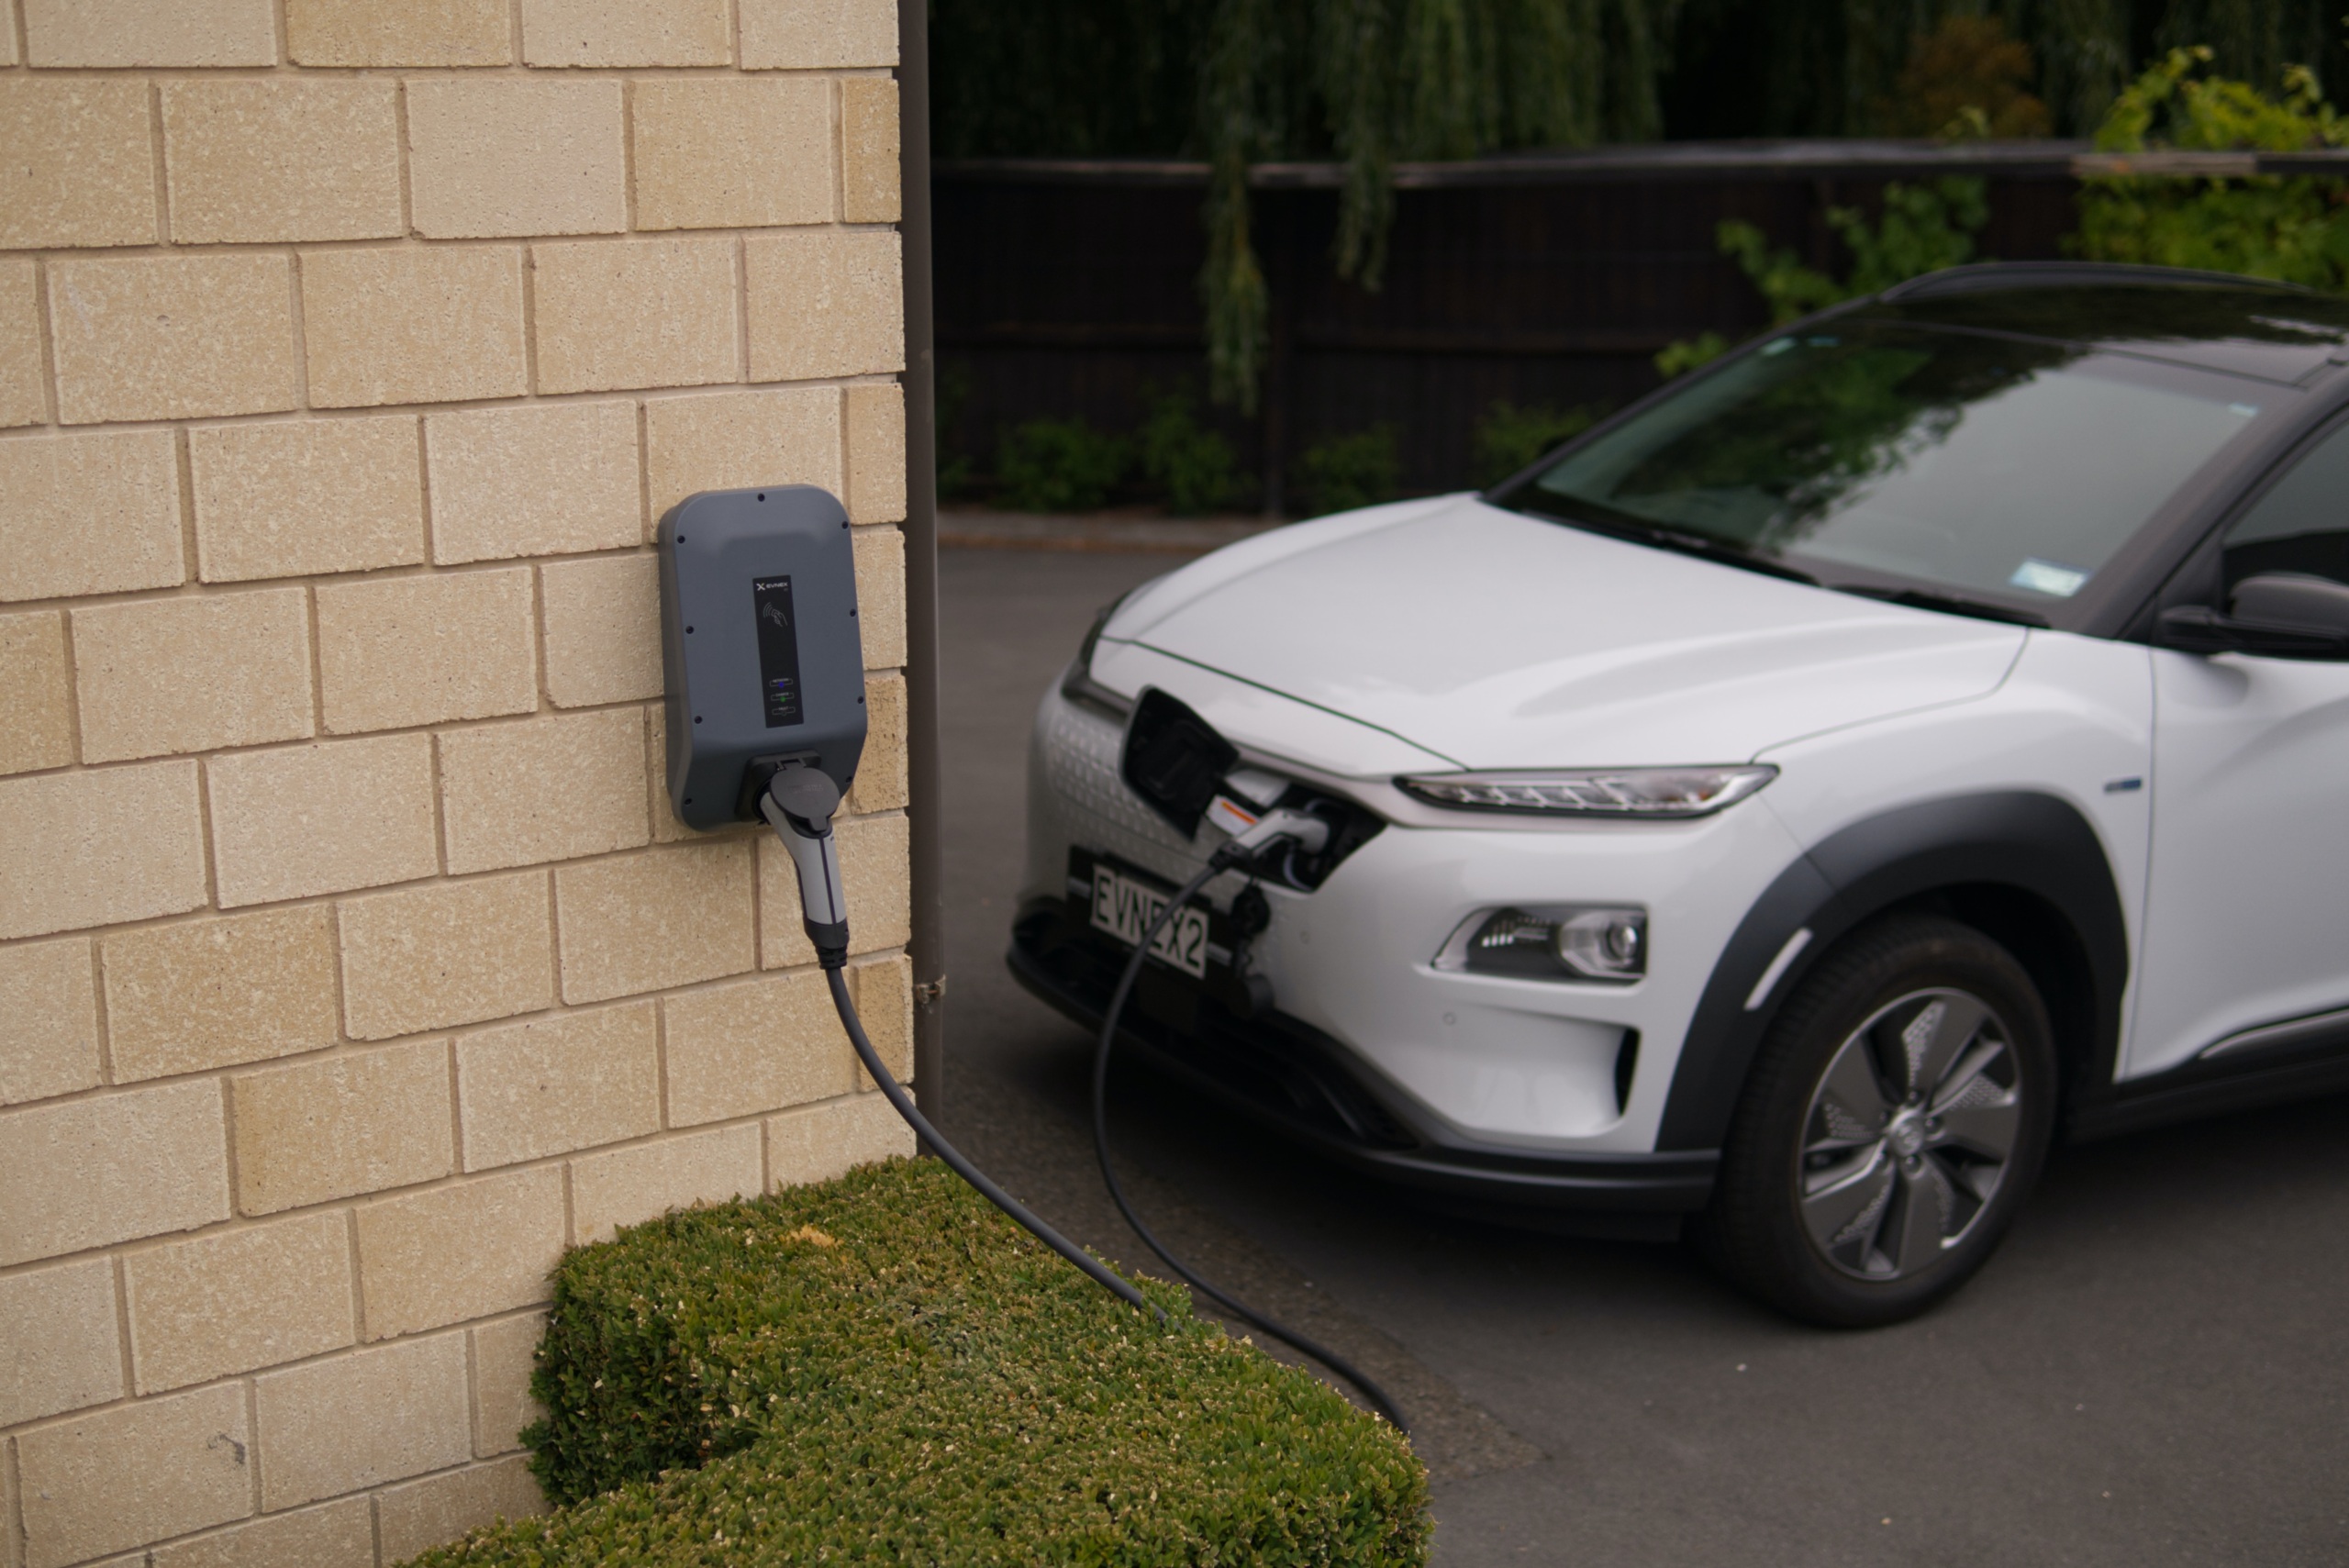
Americans bought more than 925,000 plug-in electric vehicles in 2022 – a more than 10-fold increase from 2013. Meanwhile, the number of electric vehicle chargers nationwide exceeded 151,000 – a nearly 18-fold increase from 2013.
The Inflation Reduction Act is accelerating progress toward clean energy. Here’s how:
The past decade has seen exciting progress in clean energy. With continued progress and commitment, an America powered entirely by clean, renewable energy is within reach.
Making the renewable future a reality: Recommendations for state and local governments
Now is the time for governors to go big on clean energy.

Our research and public education work are made possible by tax-deductible contributions from supporters like you.
Senior Director, Campaign for 100% Renewable Energy, Environment America Research & Policy Center
Johanna directs strategy and staff for Environment America's energy campaigns at the local, state and national level. In her prior positions, she led the campaign to ban smoking in all Maryland workplaces, helped stop the construction of a new nuclear reactor on the shores of the Chesapeake Bay and helped build the support necessary to pass the EmPOWER Maryland Act, which set a goal of reducing the state’s per capita electricity use by 15 percent. She also currently serves on the board of Community Action Works. Johanna lives in Amherst, Massachusetts, with her family, where she enjoys growing dahlias, biking and the occasional game of goaltimate.
Associate Director and Senior Policy Analyst, Frontier Group
Tony Dutzik is associate director and senior policy analyst with Frontier Group. His research and ideas on climate, energy and transportation policy have helped shape public policy debates across the U.S., and have earned coverage in media outlets from the New York Times to National Public Radio. A former journalist, Tony lives and works in Boston.