Data Visualization
Timeline of clean air milestones
Timeline of climate change milestones
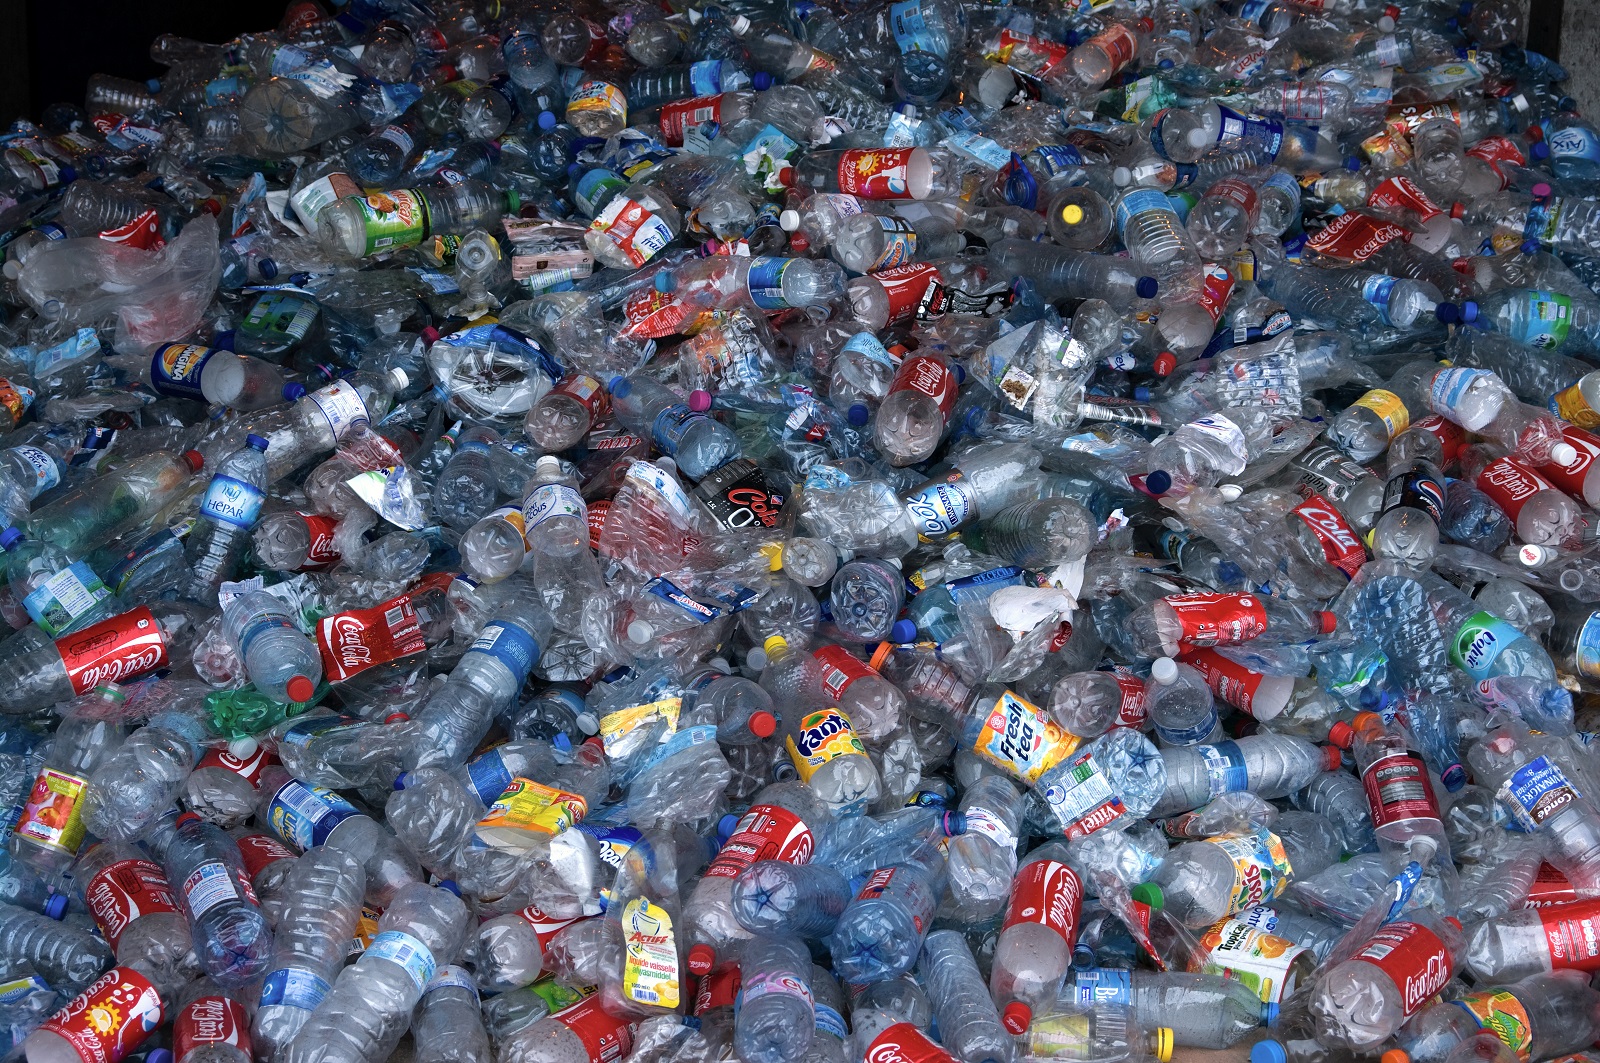
Timeline of zero waste milestones
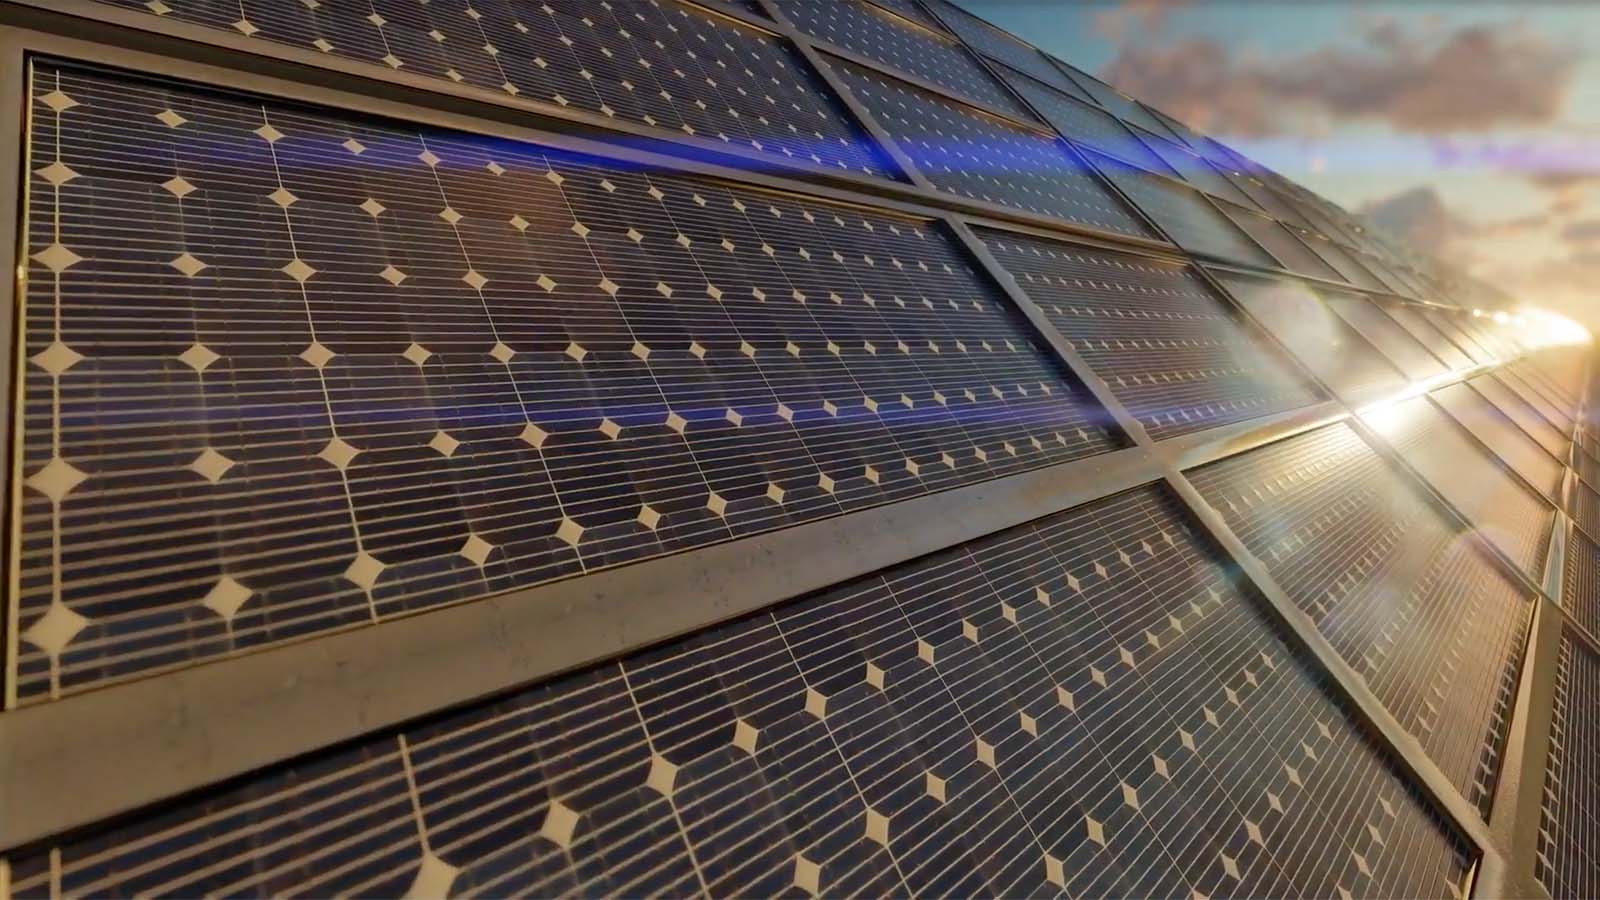
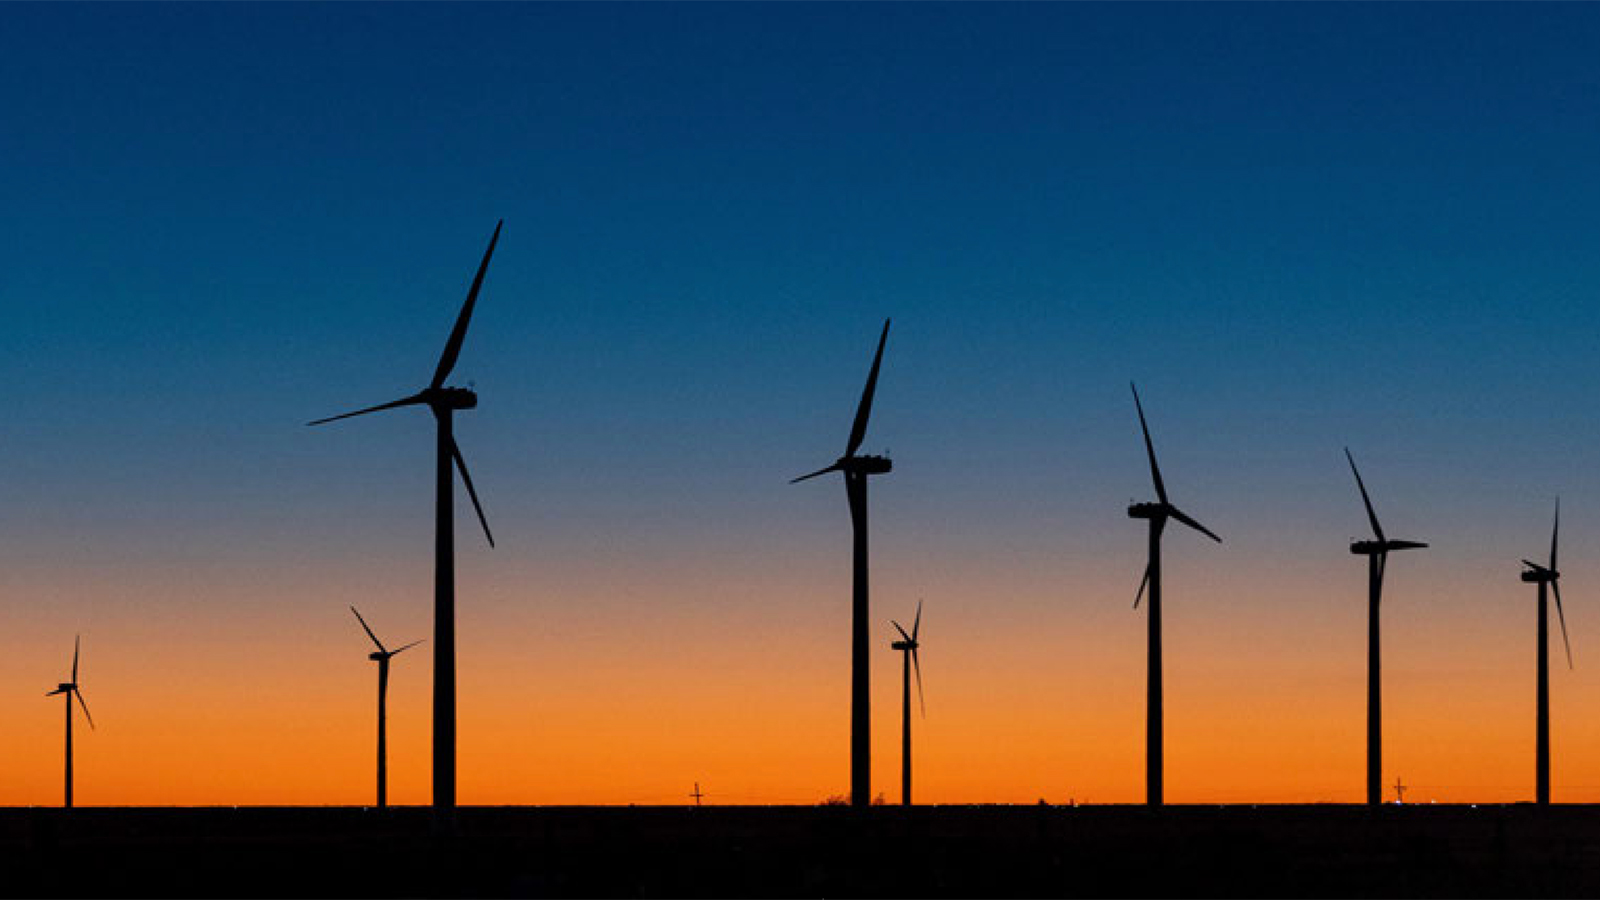
Timeline of clean energy milestones
ROTR 2024 draft
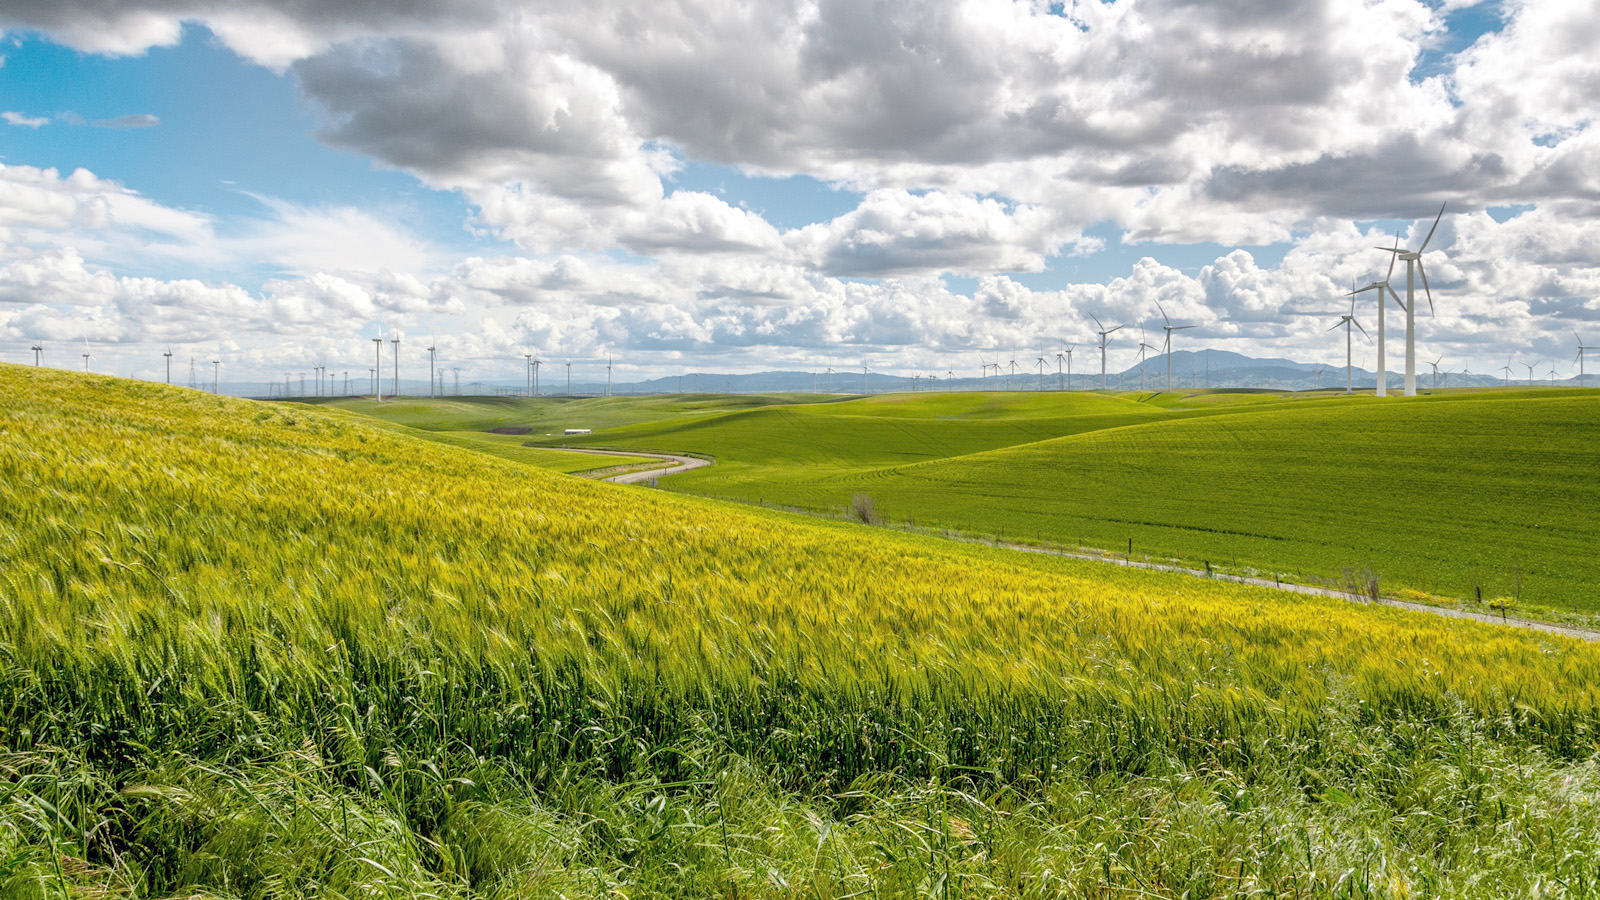
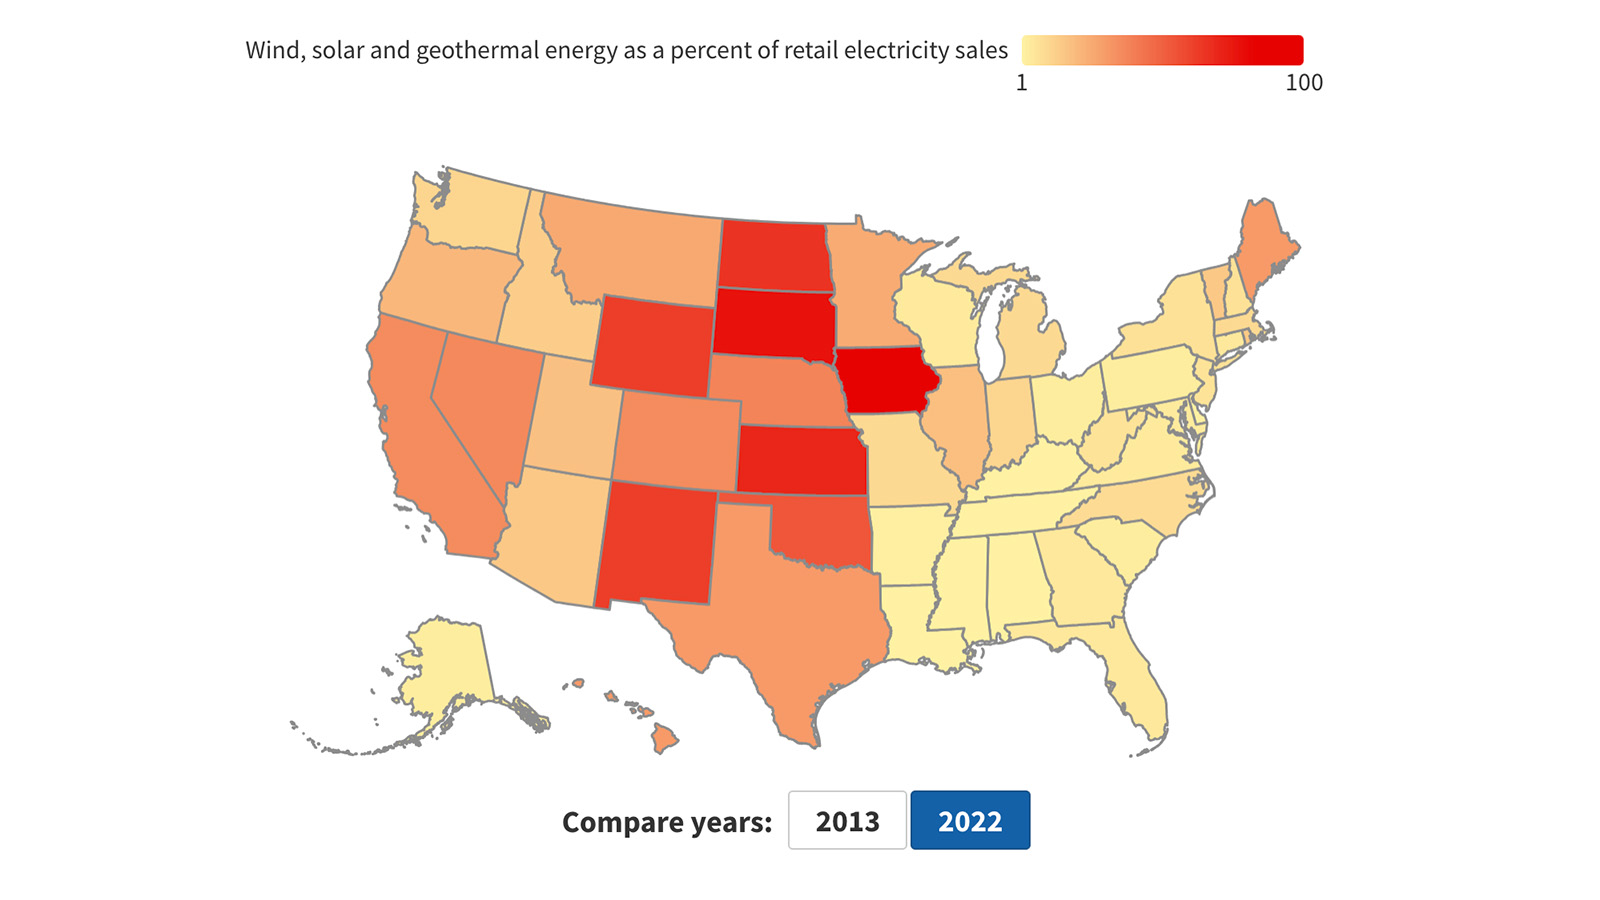
America produces more than three times as much power from the sun, the wind and the earth as we did in 2014, with growth in all 50 states. Key technologies such as electric vehicles and battery storage are also booming - helping to repower America with clean energy.
Renewables On The Rise Dashboard
America produces more than three times as much power from the sun, the wind and the earth as we did in 2013, with growth in all 50 states. Key technologies such as electric vehicles and battery storage are also booming - helping to repower America with clean energy.
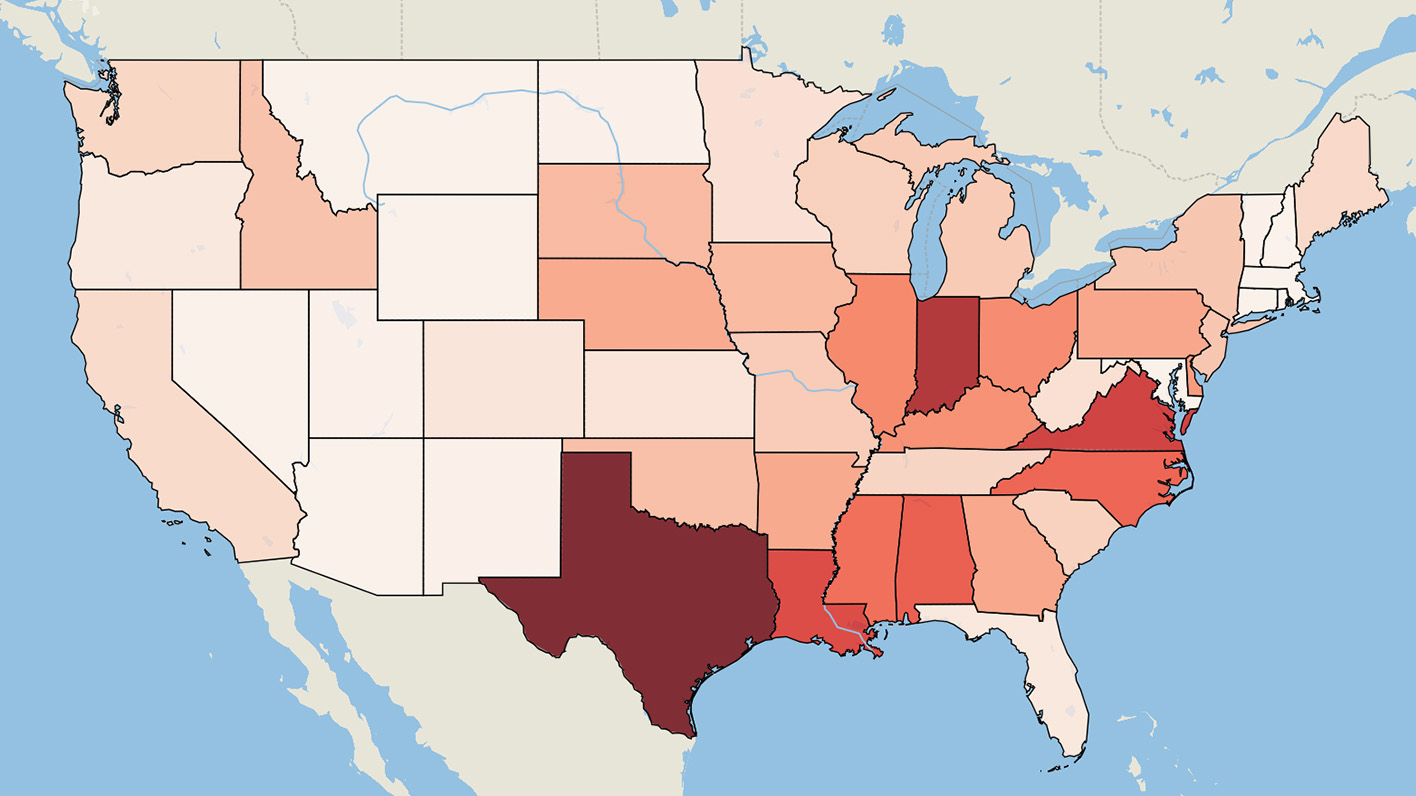
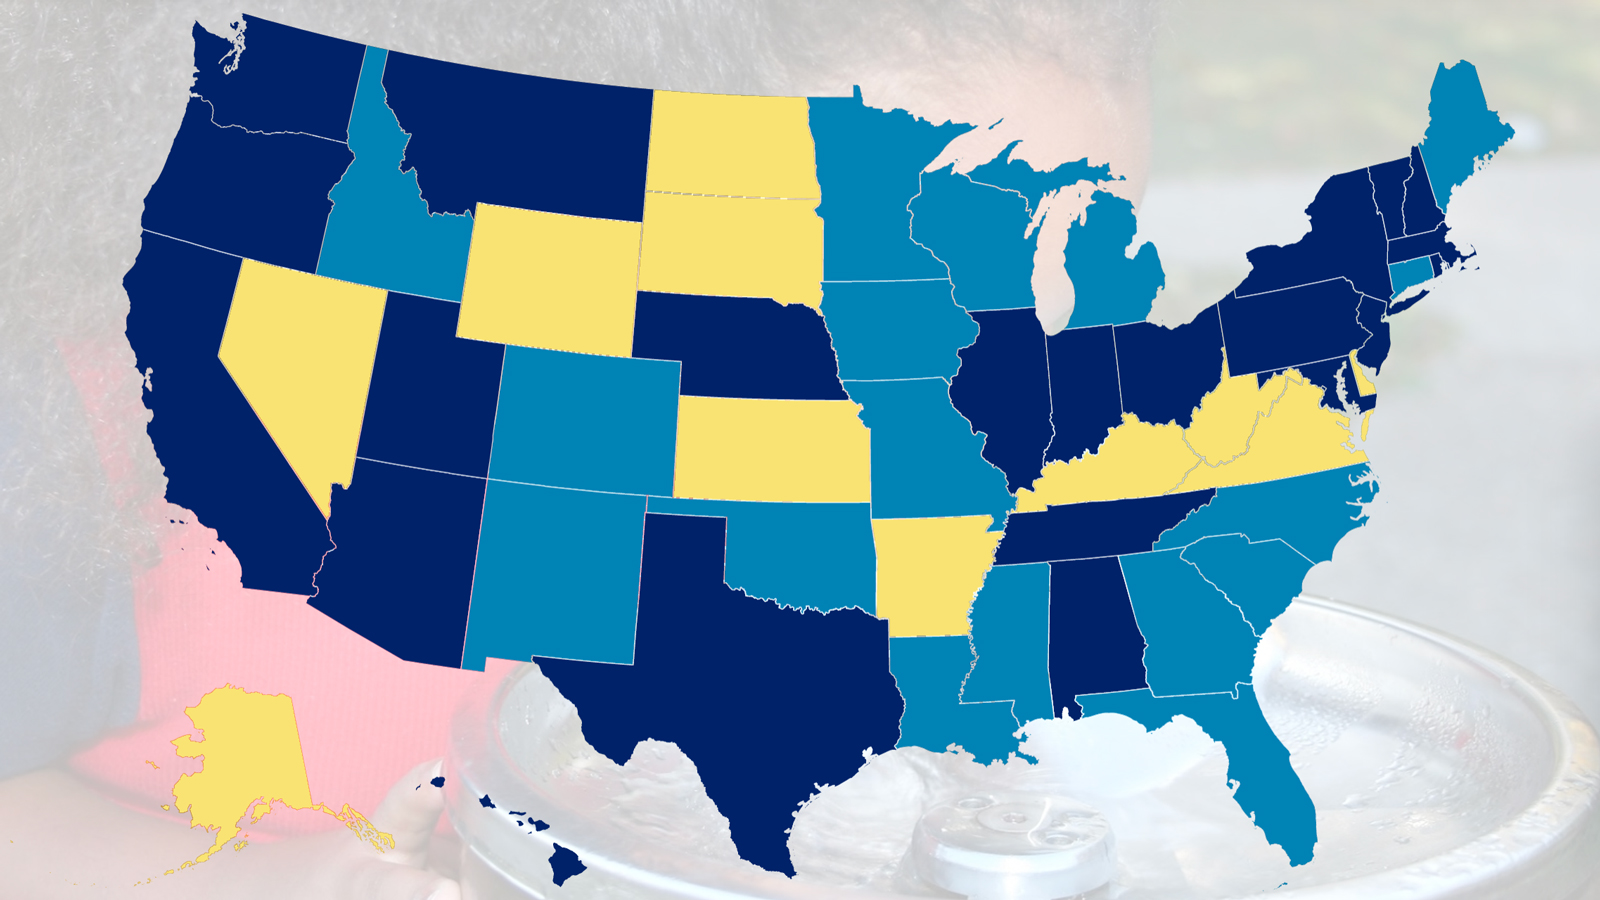
Who are the top toxic water polluters in your state?
A half-century after the passage of the Clean Water Act, industrial facilities continue to release large volumes of toxic substances into our waterways, threatening the health of people and ecosystems.
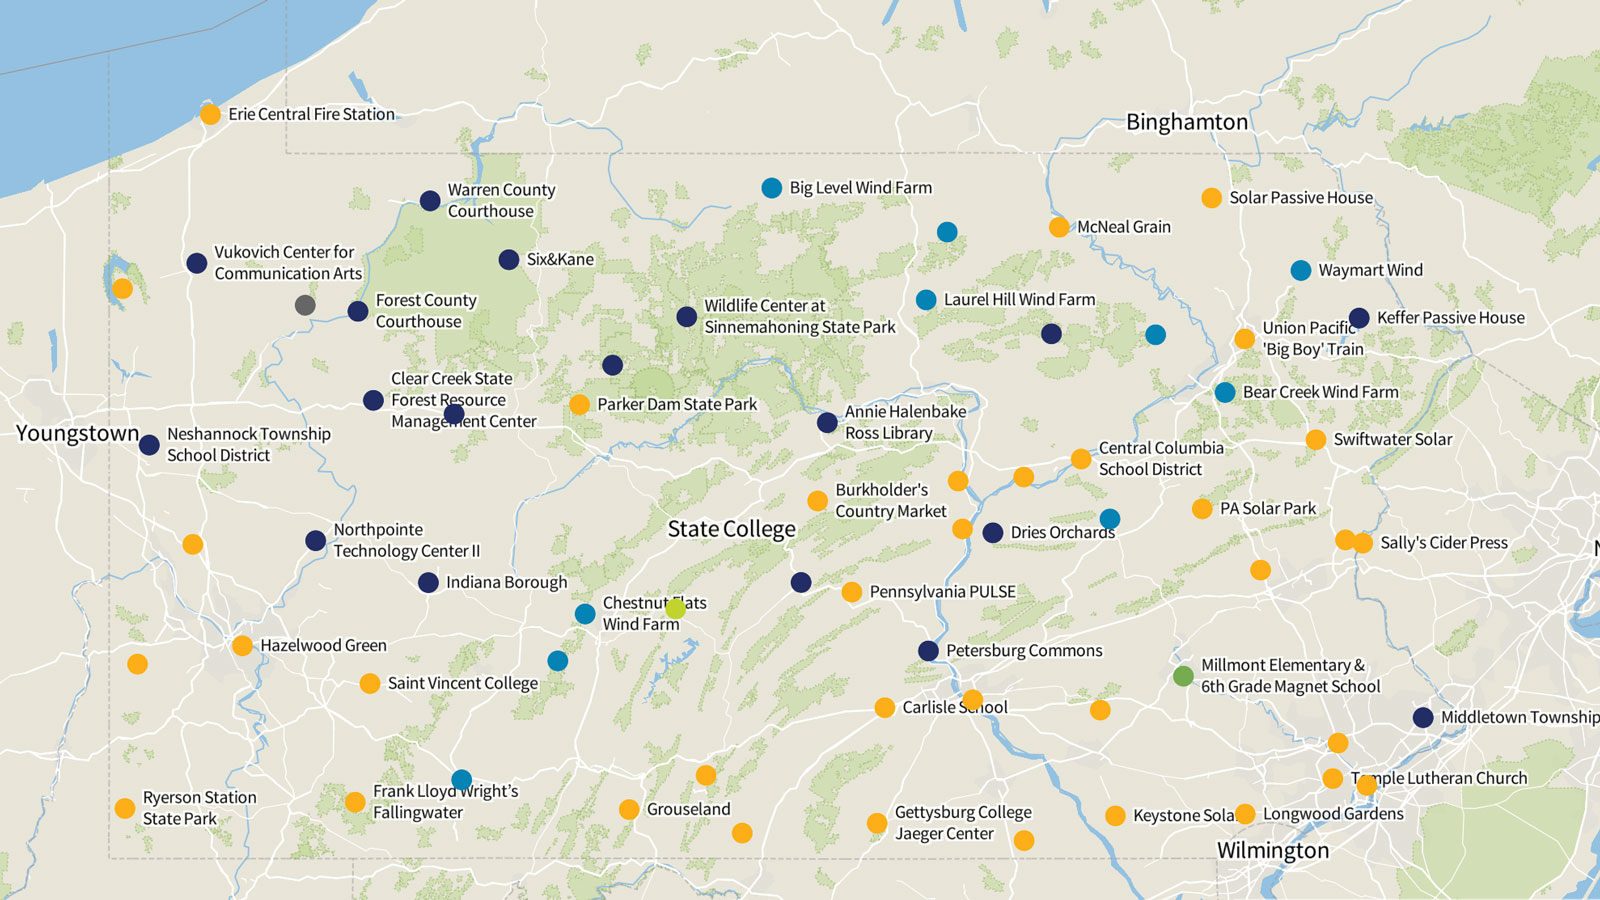
Clean Energy Commonwealth
This interactive map lets you explore a selection of renewable energy and energy efficiency case studies from each of Pennsylvania’s 67 counties.
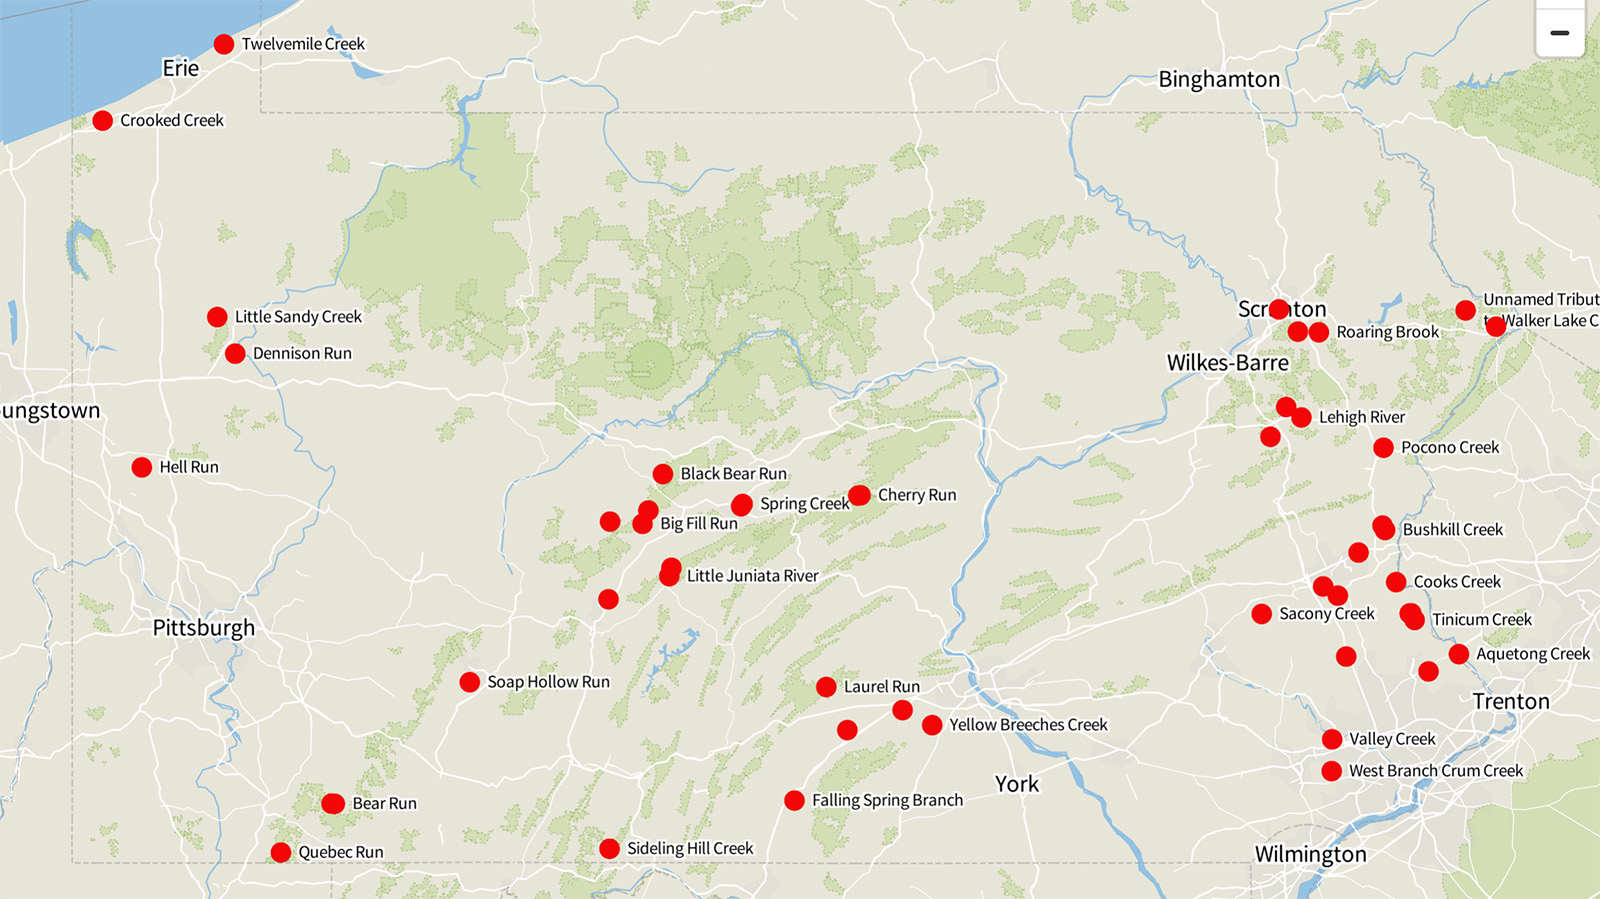
Microplastics found in Pennsylvania’s cleanest streams
PennEnvironment Research & Policy Center tested 50 waterways classified as some of the cleanest in Pennsylvania and found microplastics in every one of them. This interactive map lets you explore the results.