
People across America regularly breathe unhealthy air that increases their risk of premature death, asthma attacks and other adverse health impacts.
In 2016, 73 million Americans experienced more than 100 days of degraded air quality with the potential to harm human health. That is equal to more than three months of the year in which smog and/or particulate pollution was above the level that the EPA has determined presents “little to no risk.” Millions more people in urban and rural areas experienced less frequent but still damaging levels of air pollution.
To safeguard public health, the nation needs to preserve and strengthen existing air quality protections at the federal and state level and move to reduce the future air pollution threats posed by global warming.
Burning fossil fuels such as coal, diesel, gasoline and natural gas creates air pollution in the form of smog, particulates and air toxics. Wildfires, wood stoves, agricultural dust and other sources create additional air pollution. There is no documented safe level of exposure to some of these pollutants.[i]
Millions of Americans live in urban and rural areas that experience frequent smog and/or particulate pollution.
Table ES-1. Ten Most Populated Metropolitan Areas with More than 100 Days of Elevated Air Pollution in 2016
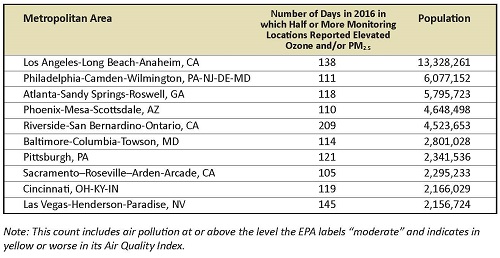
Note: This count includes air pollution at or above the level the EPA labels “moderate” and indicates in yellow or worse in its Air Quality Index.
Figure ES-1. Both Urban and Rural Areas Experienced Frequent Smog and/or Particulate Pollution in 2016[vii]
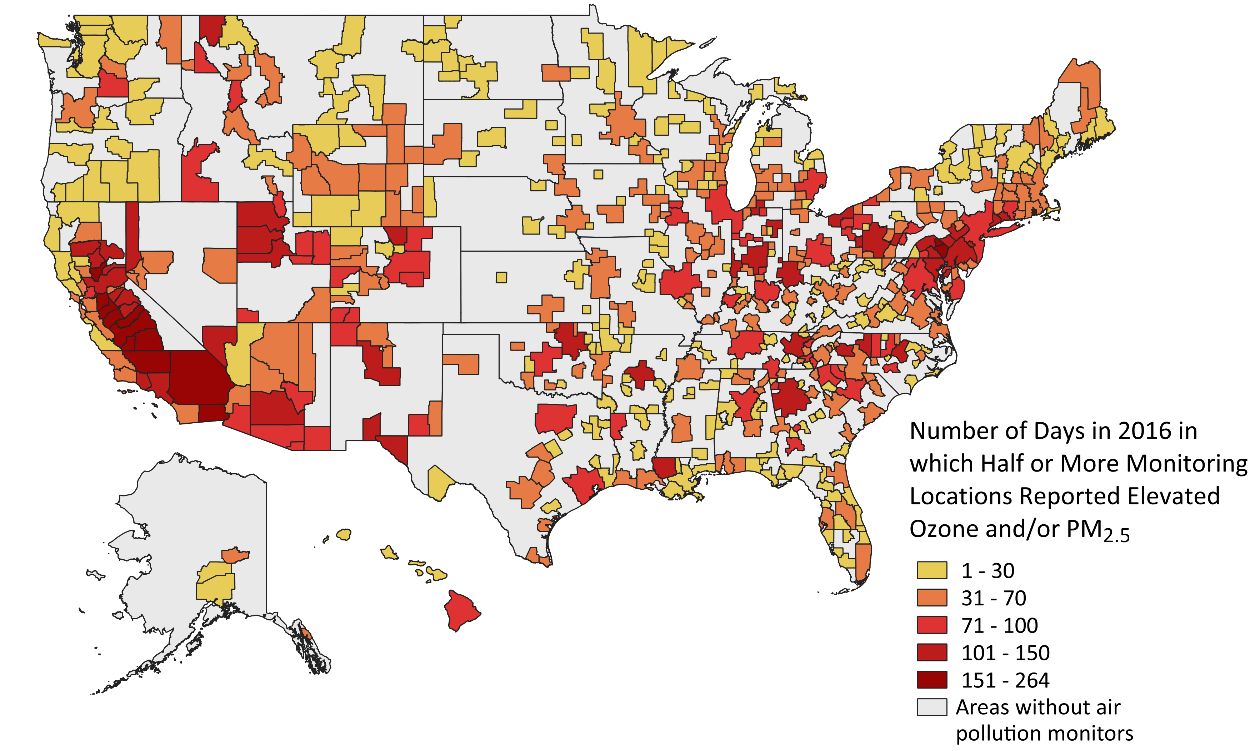
Smog pollution is a frequent health threat in some regions.
Particulate pollution affected people living in a broad range of places in 2016.
Global warming threatens to exacerbate the nation’s smog and particulate pollution problems.[viii] Higher temperatures will facilitate formation of smog and altered wind patterns may increase the number of days with stagnant air that prevents dilution of contaminants.[ix] Wildfires, which generate particulate pollution and smog precursors that can travel hundreds of miles, are predicted to become more frequent and intense.[x]
To reduce the pollution that threatens the health of people across the country, and to avoid global warming-related increases in air pollution in the future, the nation should:
[i] Michelle L. Bell, Roger D. Peng and Francesca Dominici, “The Exposure-Response Curve for Ozone and Risk of Mortality and the Adequacy of Current Ozone Regulations,” Environmental Health Perspectives, 114(4): 532-6, doi:10.1289/ehp.8816, April 2006; and World Health Organization, WHO Air Quality Guidelines for Particulate Matter, Ozone, Nitrogen Dioxide and Sulfur Dioxide, Global Update 2005, Summary of Risk Assessment, 2006, archived at web.archive.org/web/20170316035918/http://apps.who.int/iris/bitstream/10665/69477/1/WHO_SDE_PHE_OEH_06.02_e….
[ii] U.S. Environmental Protection Agency, The National Ambient Air Quality Standards: Ozone and Health (factsheet), no date, archived at web.archive.org/web/20170322214936/https://www.epa.gov/sites/production/files/2016-04/documents/20151001hea… Kendall Powell, “Ozone Exposure Throws Monkey Wrench into Infant Lungs,” Nature Medicine, 9(5), May 2003; R. McConnell et al., “Asthma in Exercising Children Exposed to Ozone: A Cohort Study,” The Lancet 359: 386-391, 2002; N. Kunzli et al., “Association Between Lifetime Ambient Ozone Exposure and Pulmonary Function in College Freshmen – Results of a Pilot Study,” Environmental Research 72: 8-16, 1997; I.B. Tager et al., “Chronic Exposure to Ambient Ozone and Lung Function in Young Adults,” Epidemiology, 16: 751-9, November 2005.
[iii] U.S. Environmental Protection Agency, The National Ambient Air Quality Standards for Particle Pollution: Particle Pollution and Health (factsheet), no date; and J. Pekkanen et al., “Daily Variations of Particulate Air Pollution and ST-T Depressions in Subjects with Stable Coronary Heart Disease: The Finnish ULTRA Study,” American Journal of Respiratory Critical Care Medicine, 161: A24, 2000.
[iv] L. Trasande, P. Malecha and T.M. Attina, “Particulate Matter Exposure and Preterm Birth: Estimates of U.S. Attributable Burden and Economic Costs,” Environmental Health Perspectives, 124(12): 1913-1918, dx.doi.org/10.1289/ehp.1510810, December 2016; Raanan Raz et al., “Autism Spectrum Disorder and Particulate Matter Air Pollution before, during, and after Pregnancy: A Nested Case-Control Analysis within the Nurses’ Health Study II Cohort,” Environmental Health Perspectives, 123: 264-270, dx.doi.org/10.1289/ehp.1408133, 1 March 2015; W.J. Gauderman et al., “The Effect of Air Pollution on Lung Development from 10 to 18 Years of Age,” The New England Journal of Medicine 351: 1057-67, 9 September 2004; and U.S. Environmental Protection Agency, The National Ambient Air Quality Standards for Particle Pollution: Particle Pollution and Health (factsheet), no date.
[v] M. Cacciottolo et al., “Particulate Air Pollutants, APOE Alleles and Their Contributions to Cognitive Impairment in Older Women and to Amyloidodgenesis in Experimental Models,” Translational Psychiatry, doi:10.1038/tp.2016.280, 31 January 2017.
[vi] Michelle L. Bell, Roger D. Peng and Francesca Dominici, “The Exposure-Response Curve for Ozone and Risk of Mortality and the Adequacy of Current Ozone Regulations,” Environmental Health Perspectives, 114(4): 532-6, doi:10.1289/ehp.8816, April 2006, and Qian Di et al., “Association of Short-Term Exposure to Air Pollution with Mortality in Older Adults,” JAMA, 318(24): 2446-2456, doi:10.1001/jama.2017.17923, 26 December 2017.
[vii] The map shows Census-designated metropolitan and micropolitan areas, plus rural counties that have an air pollution monitor. Note that Macon, Georgia, is mapped to Macon County. The towns of Bishop, CA; Rockland, ME; and Walterboro, SC, are not shown because they are not included in the Census Bureau shapefiles for mapping.
[viii] Neal Fann et al., “Chapter 3: Air Quality Impacts,” The Impacts of Climate Change on Human Health in the United States: A Scientific Assessment, U.S. Global Change Research Program, dx.doi.org/10.7930/J0GQ6VP6, 2016.
[ix] Climate Central, Stagnant Air on the Rise, Upping Ozone Risk, 17 August 2016, archived at web.archive.org/web/20170218012058/http://www.climatecentral.org/news/stagnation-air-conditions-on-the-rise….
[x] George Luber et al., “Chapter 9: Human Health,” Climate Change Impacts in the United States: The Third National Climate Assessment, U.S. Global Change Research Program, doi:10.7930/J0PN93H5, 2014.
[xi] U.S. Environmental Protection Agency, Office of Air and Radiation, The Benefits and Costs of the Clean Air Act from 1990 to 2020, April 2011, archived at web.archive.org/web/20151019090948/https://www2.epa.gov/sites/production/files/2015-07/documents/fullreport….