
Tell the Governor: Make our beaches safe for swimming

America's beaches are favorite places to relax ... when the water is safe. Where is water pollution harming our ability to enjoy the beach? And what can we do to stop it?
Americans love the beach. Our lake and ocean waters are great places to cool off on a hot day, to relax with friends and family, or simply to enjoy peace and quiet amid nature.
Too often, however, water pollution ruins our enjoyment of the beach – and it can even make us sick. Fecal contamination from sources such as urban runoff, sewage overflows and factory farms can contain pathogens that threaten the health of swimmers, or that force beaches to be closed to protect public health.
How often do fecal contamination levels at America’s beaches pose a potential threat to our health? And what steps can we take to reduce water pollution that harms our coastal waters?
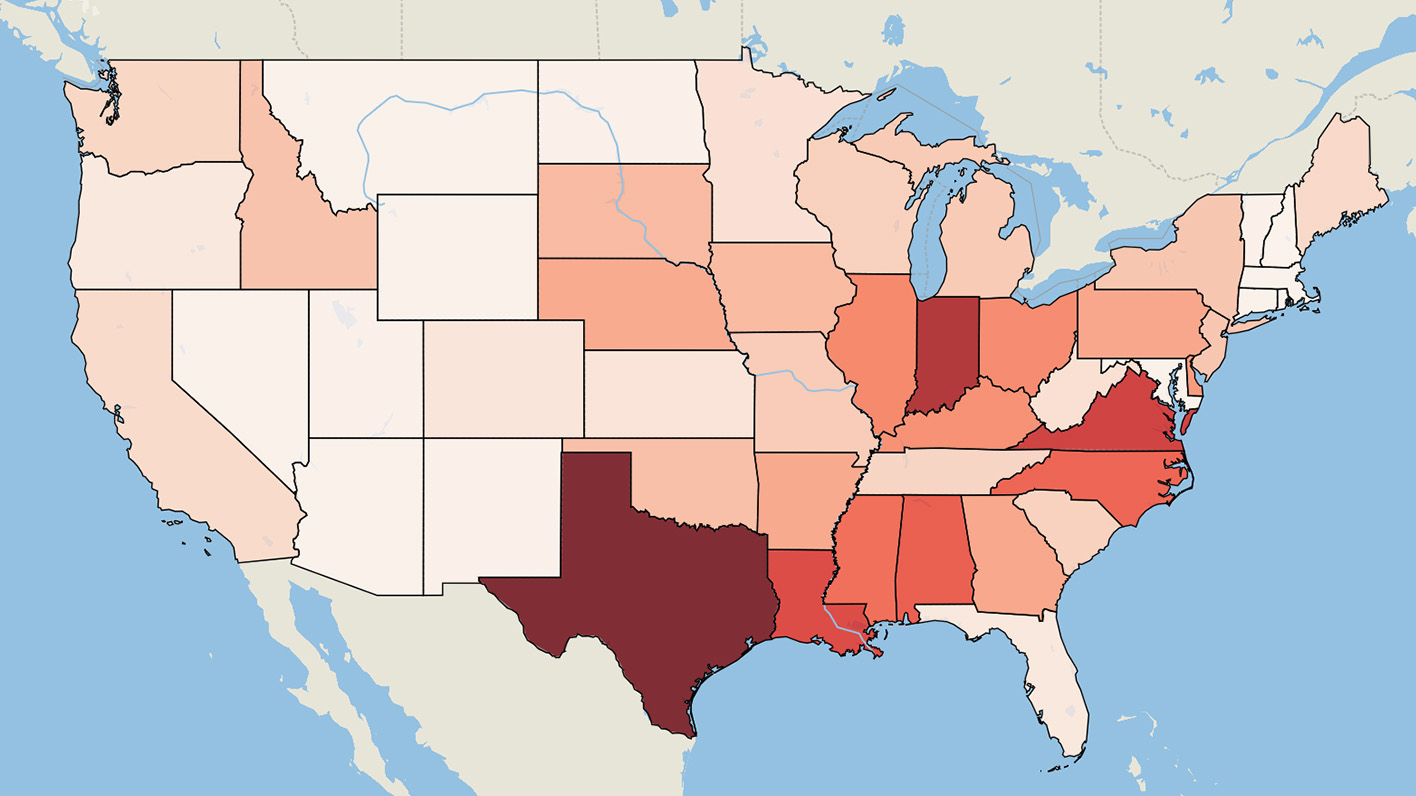
In 2022, 1,761 out of 3,192 tested beaches nationwide (55%) experienced at least one day on which fecal contamination reached potentially unsafe levels – that is, exceeding EPA’s most protective “Beach Action Value,” a conservative, precautionary tool states can use to make beach notification decisions. Beaches may also have experienced contamination on days when testing did not take place. (See “Methodology” below.)
And 363 beaches – approximately one out of every nine beaches tested nationwide – had potentially unsafe levels of fecal contamination on at least 25% of the days on which testing took place.
States vary in how frequently and widely they test their beaches. The dashboard below shows the number of days with tests showing potentially unsafe levels of fecal indicator criteria in each state in 2022, as well as the percentage of days on which testing took place. Choose a state below to begin.
Swimming in contaminated water can cause gastrointestinal illness as well as respiratory disease, ear and eye infection, and skin rash. Each year, there are an estimated 57 million cases of illness in the U.S. resulting from swimming in oceans, lakes, rivers and ponds. The vast majority of these illnesses go unreported.
Contaminated water can also trigger health warnings or closures that interfere with our ability to enjoy the beach. There were more than 8,700 health warnings or closures at U.S. coastal and Great Lakes beaches in 2022, affecting one out of every 12 swimming days.
Significant sources of pathogen pollution that can make swimmers sick include stormwater runoff, sewage overflows and in some places, manure from industrial livestock production.
In recent years, three trends have increased the pollution risk from these sources:
Congress took a big step to reduce the threat of beach pollution by passing the Infrastructure Investment and Jobs Act (otherwise known as the bipartisan infrastructure law) in 2021. The law not only directly provides $11.7 billion for sewage and stormwater projects but also authorizes an additional $14.65 billion for that purpose. The EPA estimates the actual need for wastewater infrastructure at $271 billion.
But there is much more we can do to protect and improve water quality at our beaches – and at all of America’s waterways. Local, state and federal governments should:
There are too many days when pollution closes our beaches or makes swimmers sick. We're calling on the governor to take action to clean up the state's waters.
National beach fecal indicator bacteria testing data were downloaded from the National Water Quality Monitoring Council’s Water Quality Portal (WQP) on 31 May 2023. [1] This analysis includes water quality data at all beaches listed under the BEACH Act located in U.S. states and Puerto Rico for which 2022 testing data was available. [2] Some beaches included in this analysis are now considered “historical” BEACH Act beaches, and are monitored under separate programs. State and tribal beach program coordinators were contacted to confirm that their jurisdictions had finished submitting and verifying data for the 2022 swimming season to the EPA. [3] Illinois reported that it had not finished verifying its data and would likely not do so until the fall – data from Illinois in this analysis should be considered incomplete. Michigan reported that its state beach monitoring data may be further revised in the future. As of June 2023, Indiana, Ohio and Puerto Rico had not responded to confirm the completeness of their data.
Data for Chicago beaches was downloaded from an alternate source, the City of Chicago’s data portal. [4] Chicago beach sample results were taken from the data field “DNA Reading Mean.” Data for beaches in Evanston and Wilmette, Illinois, was supplied by the respective local governments. Beach testing data was requested directly from other jurisdictions in Cook County, Illinois, but was not submitted prior to the deadline for this analysis. Additionally, data for Maine, Michigan, Texas and Virginia was obtained separately, as those states had final data that was not reflected in the WQP. [5]
Beach sites were considered “potentially unsafe” if sample results exceeded the EPA Beach Action Value (BAV) associated with an estimated illness rate of 32 per 1,000 swimmers, with two exceptions as noted below. [6] The EPA suggests states use BAVs “as a conservative, precautionary tool for making beach notification decisions.” [7] As most states use different criteria for assessing beach safety (often based on each state’s water quality standards) the number of beach days identified as of concern may differ from state agency reports on beach water quality. The following BAVs were used for assessing beach safety:
• For enterococcus, the BAV is 60 colony-forming units per 100 milliliters (cfu/100mL), for both marine and fresh water.
• For E. coli the BAV is 190 cfu/100mL, for fresh water only.
• For enterococcus tests conducted using a quantitative polymerase chain reaction (qPCR) method, in Chicago, with results reported as calibrator cell equivalent (cce) per 100mL, the BAV is 640 cce/100mL, for both marine and fresh water.
Several jurisdictions reported testing results for which a national BAV consistent with the 32 illnesses per 1,000 swimmers benchmark has not yet been established. The state of California conducts extensive testing for E. coli in marine waters, for which the state has adopted its own safety standards. These tests (and a smaller number of marine E. coli tests in Maryland) are excluded from this analysis. Beaches for which E. coli test results were not considered are indicated as such in the data tables.
San Diego County, California, and the state of Michigan use different forms of polymerase chain reaction (PCR) rapid beach testing, which allows for same-day notification of potential beach safety issues. The U.S. EPA has approved a benchmark of 1,413 DNA copies/100mL for enterococcus in San Diego County [8], while Michigan uses a standard of 1.863 log10 copies/reaction for E. coli. [9] Both metrics correspond to enterococcus/E. coli levels from traditional tests that are less stringent than the BAVs used elsewhere in this analysis. In order to provide as complete a picture of beach safety as possible, and in the absence of established thresholds for these tests at the 32 illnesses/swimmers benchmark, the state standards for these measures are used to determine the existence of a “potentially unsafe” beach day. Beaches at which these tests have been used are indicated as such in the data tables.
In general, a “potentially unsafe day” is one in which a single test at a particular beach exceeded the BAV for fecal indicator bacteria. This includes beaches with multiple monitoring sites or that conduct multiple tests per day. States vary widely in their definitions of what constitutes a “beach,” with some states reporting data for multiple testing sites spread over several miles under a single beach name and ID and others reporting data for smaller beach segments separately. There is no standard way to ensure uniformity across states, so readers are advised not to compare the number or percentage of potentially unsafe days across state lines. Beaches with multiple monitoring sites are indicated as such in the data tables.
Some states submit the mean of a day’s testing results at a particular site rather than, or in addition to, individual test results. In these cases, exceedance of the BAV by the mean value is treated the same as an exceedance of the single-test value (since at least one individual test value would have to exceed the limit in order for the mean value to be exceeded). However, use of the mean may result in some beaches with individual test values in exceedance of the BAV not being identified as such.
State tables of beach sites generally include the 10 beaches with the most potentially unsafe days, ordered by most to fewest. Tables are secondarily ordered by fewest to most days with testing.
The average percentage of potentially unsafe days by county was calculated by averaging percentages of potentially unsafe sampling days for all beaches within each county.
Some data cleanup and categorization were performed before conducting analysis and mapping:
Water quality data was linked to beach attribute data, such as beach name and location, using each water sample’s associated “Beach ID.” In the WQP, Beach IDs are listed under the attribute “ProjectIdentifier.” Beach attribute data was obtained through the EPA’s Beach Advisory and Closing Online Notification (BEACON) system. [10] Beach names were cleaned and formatted by standardizing common symbols and abbreviations, as well as based on information from BEACON or from state website listings of beaches.
Location data for displaying beach sites on maps comes from two sources. The majority of beach locations were based on the midpoint of start and end points contained in the beach attributes available through BEACON. [11] For beaches where such information was either not available or was obviously incorrect, beach location was obtained for the beach’s affiliated sampling site from the National Water Quality Monitoring Council’s Water Quality Portal. [12] Because of the nature of the geotagging process, and despite the authors’ efforts to correct erroneous locations, sample sites displayed on maps may occasionally reflect imprecise locations.
For regional aggregations, most beaches were assigned to regions based on their state. New York and Florida both contain sample sites grouped to two different regions: New York has sample sites in the Great Lakes and the East Coast, and Florida has sample sites in the Gulf and the East Coast. Those beaches were assigned based on their BEACON “Waterbody Name” attribute.
In addition to each to each sample’s recorded measurement, other information in the WQP had the potential to affect how samples were treated in this analysis:
Samples with parameter ResultDetectionConditionText of “Present Above Quantification Limit” were assumed to have a bacteria count equal to that test record’s quantification limit, from the field “DetectionQuantitationLimitMeasure/MeasureValue.”
Measure values recorded as “less than” a specific number value (indicated with a “<” symbol) were treated as safe samples. Measure values indicated as “more than” a value (indicated with a “>” symbol) were treated as the value that followed the symbol.
Samples with measure values recorded as “DELETED,” “-99” or “-999.99” were deleted.
Measurements for which the parameter “ResultMeasure/MeasureUnitCode” was not specified were assumed to be reported in colony-forming units (cfu) per 100 milliliters (as opposed to calibrator cell equivalents reported for the still-rarely-used quantitative polymerase chain reaction tests).
Sample results were not considered if comment text indicated a problem with the test, including “sample results inconclusive.”
Sample results were not considered if parameter “StatisticalBaseCode” was recorded as a “30-day Geometric Mean” test, as multi-day tests (often used to determine compliance with water quality standards) cannot be used to determine beach safety for specific days.
Notes
[1] Sampling data was downloaded for all test results where result parameter “CharacteristicName” was equal to Enterococcus or Escherichia coli, for the year 2022. National Water Quality Monitoring Council, Water Quality Data, downloaded from https://www.waterqualitydata.us/portal/ on 31 May 2023.
[2] Specifically, samples were included if they had a “Beach ID” matching a beach in the BEACON system, and if that Beach ID matched a beach that was marked as a BEACH Act Beach in the Beach Profile report available through BEACON at https://beacon.epa.gov/ords/beacon2/f?p=137:18:1909967884368.
[3] Coordinator contact information accessed via U.S. Environmental Protection Agency, “State, Territorial, Tribal and EPA Beach Program Contacts,” updated 3 August 2022, accessed 19 May 2023 at https://www.epa.gov/beaches/state-territorial-tribal-and-epa-beach-program-contacts.
[4] City of Chicago Data Portal, Beach Lab Data – DNA Tests, downloaded 11 April 2023 from https://data.cityofchicago.org/Parks-Recreation/Beach-Lab-Data-DNA-Tests/hmqm-anjq.
[5] Maine data: Sarah Gensel, personal communication, 2 May 2023. Texas data: via request to the Texas General Land Office, https://s3.glo.texas.gov/glo/the-glo/public-information/requests/index.html, obtained 8 May 2022. Michigan data: Michigan Department of Environment, Great Lakes, and Energy, Michigan BeachGuard System, “Search/Export,” data downloaded 26 June 2023 at http://www.egle.state.mi.us/
[6] U.S. Environmental Protection Agency, 2012 Recreational Water Quality Criteria, 2012, p. 44, archived at http://web.archive.org/web/20190502174719/https://www.epa.gov/sites/production/files/2015-10/documents/rwqc2012.pdf.
[7] Ibid.
[8] Terrence Fleming, U.S. Environmental Protection Agency Region IX, Letter to Lars Seifert RE: Request for Concurrence to Implement ddPCR for Beach Water Quality Rapid Detection Method for Recreational Beaches in San Diego County, 6 October 2020, archived at https://web.archive.org/web/20230626215056/https://www.epa.gov/sites/default/files/2021-04/documents/epa_approval_of_ddpcr_beach_pilot-san-diego-c-10-06-2020.pdf.
[9] S. Briggs, et al., “Derivation of the equivalent qPCR value for Escherichia coli to existing culture-based water quality standards for monitoring beaches in Michigan,” IWA 20th International Symposium on Health Related Water Microbiology, Vienna, Austria, September 15 – 20, 2019 [abstract], accessed at https://cfpub.epa.gov/si/si_public_record_report.cfm?Lab=NERL&dirEntryId=346775.
[10] U.S. Environmental Protection Agency, BEACON 2.0 – Beach Attributes report, downloaded 10 April 2023 from https://beacon.epa.gov/ords/beacon2/f?p=137:5:15170646485344.
[11] Specifically, beach latitude and longitude were calculated as the average of start and end latitudes, and the average of start and end longitudes. Beach attribute data source: U.S. Environmental Protection Agency, BEACON 2.0 – Beach Attributes report, downloaded 10 April 2023 from https://beacon.epa.gov/ords/beacon2/f?p=137:5:15170646485344.
[12] National Water Quality Monitoring Council, Water Quality Portal, site data downloaded on 5 May 2021 from https://www.waterqualitydata.us/portal/.
Clean Water Director and Senior Attorney, Environment America Research & Policy Center
John directs Environment America's efforts to protect our rivers, lakes, streams and drinking water. John’s areas of expertise include lead and other toxic threats to drinking water, factory farms and agribusiness pollution, algal blooms, fracking and the federal Clean Water Act. He previously worked as a staff attorney for Alternatives for Community & Environment and Tobacco Control Resource Center. John lives in Brookline, Massachusetts, with his family, where he enjoys cooking, running, playing tennis, chess and building sandcastles on the beach.
Associate Director and Senior Policy Analyst, Frontier Group
Tony Dutzik is associate director and senior policy analyst with Frontier Group. His research and ideas on climate, energy and transportation policy have helped shape public policy debates across the U.S., and have earned coverage in media outlets from the New York Times to National Public Radio. A former journalist, Tony lives and works in Boston.