

Bolder action needed to make local waterways consistently clean for recreation
While Philadelphia has made some progress towards cleaner water, on far too many days the city’s wastewater system still pours huge volumes of raw sewage and runoff pollution into local rivers and creeks. The city, in concert with all levels of government, should ramp up efforts to ensure that these waterways are consistently clean for recreation – as envisioned by the Clean Water Act.

The Delaware River watershed is a defining feature of Philadelphia. It shapes the city, provides drinking water for millions of people and offers immense potential for the region’s residents to play on the water. While there might be other ways to stay cool in the summertime, people yearn to interact with nature by floating, boating or swimming in our waterways.
Some residents come to Bartram’s Garden for kayaking, rowing and fishing on the lower Schuylkill River [2]. Others seek water recreation at Tacony or Cobbs Creek, or at several locations along the Delaware River itself – such as Glen Foerd and Penns Landing [3]. As many as 13,476 Philadelphia residents obtained fishing licenses in 2022 [4]. And just across the Delaware River, New Jersey residents connect with the water at Palmyra Cove or Pyne Point Park.
With a profound awareness of how water recreation enriches our lives, our nation came together more than 50 years ago to declare that our waterways should be clean for swimming and fishing. That enduring goal of the Clean Water Act applies to all of Philadelphia’s rivers and creeks.
Despite significant efforts over the past decade, Philadelphia’s wastewater system still pours billions of gallons of pollution into local waterways. Roughly 60 percent of Philadelphia is served by a combined sewer system, where stormwater and sewage flow through the same pipes beneath city streets and are sent to a wastewater treatment plant [5]. A combined sewer overflow (CSO) typically occurs when rainfall overwhelms the system’s capacity, and raw sewage mixed with stormwater flows untreated into a waterway [6]. The Philadelphia combined wastewater system has three treatment plants – Northeast, Southeast and Southwest – and 164 outfalls where overflows discharge into local waterways [7]. For the rest of the city, sewage and stormwater run in separate pipes, but sanitary sewer overflow (SSO) can still occur when the sewage line is blocked or stormwater infiltrates through leaks. Stormwater runoff also flows directly into rivers and streams from roadways, parking lots and other impervious surfaces. All of these pollution flows – CSOs, SSOs and runoff – primarily occur during wet weather.
The interactive map in Figure 1 shows the location of all 164 CSO outfalls, data on their overflows and several water recreation locations along waterways receiving their pollution.
Many outfalls in the city’s combined sewer system continue to overflow on a significant number of days. Five out of 6 local watersheds – Cobbs, Delaware, Frankford, Schuylkill and Tacony – receive sewage pollution at least 64 times in an average year from one or more CSO outfalls [8].
As sewage pollution can linger in local waters, the number of days lost to water recreation can greatly exceed the number of CSO occurrences. According to the City of Philadelphia, “[w]aterways where a combined sewer outfall is overflowing are unsafe for any type of recreation, and may remain unsafe for recreation for a period of up to 72 hours following storm events, particularly in the Delaware and tidal Schuylkill rivers.”[9]
Even if we assume that CSO health threats only last for 24 hours after rainfall [10], the days of lost water recreation days would be double the number of overflow events. Thus, an average of 64 overflows per year from just one CSO outfall into Tacony Creek translates into 128 days when residents cannot play in that local waterway without putting their health at risk. The average frequency of overflows from at least one CSO outfall is even higher for the Cobbs, Delaware, Frankford and Schuylkill watersheds, as shown Figure 2.
During PWD’s most recent reporting period, at least one CSO outfall in each local watershed had more frequent overflows than average, as shown in Figure 2 [11]. For example, Philadelphia residents lost at least 162 days of water recreation on portions of the Schuylkill River impacted by CSO S05 during this period (July 2021 to June 2022).
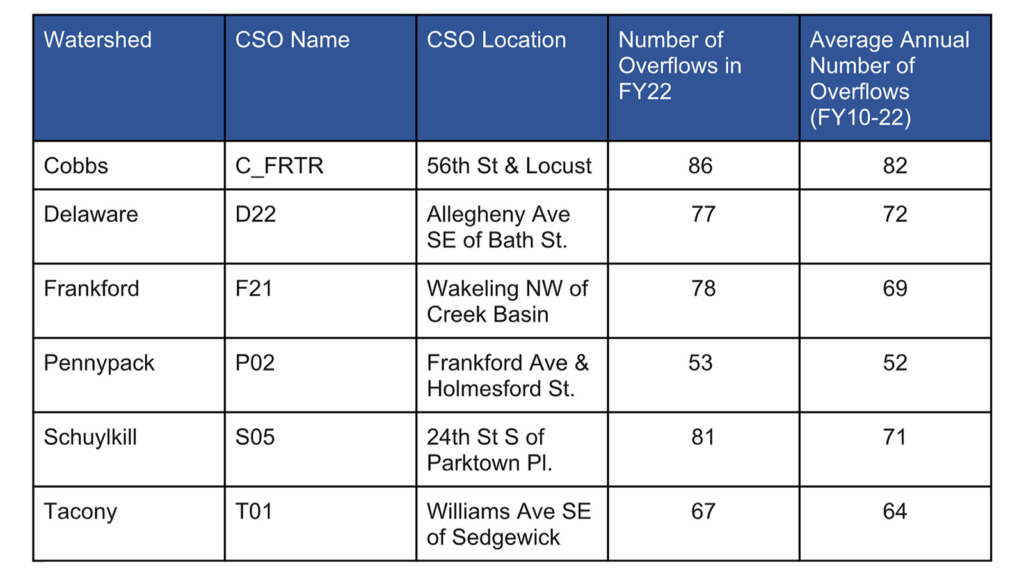
Figure 2. CSOs with the most frequent overflows in each local watershed (FY22) [12]Photo by John Rumpler | TPIN
Overflows frequently pollute these waters from multiple CSO locations. For the 12-month period covered by PWD’s most recent (FY22) annual report:
Significantly, this 12-month period had roughly 6 percent less precipitation than the average over PWD’s past five fiscal years [13]. While a 6 percent difference in rainfall might seem minor, even a relatively small amount of additional rain can cause an overflow. On Labor Day in 2019, just a quarter inch of rain caused a 9-fold spike in sewage and stormwater at Frankford Creek in Juniata Park, resulting in an overflow [14].
On the days that Philadelphia’s combined sewers overflow, the volume of pollution is staggeringly high. According to PWD data from FY2010 to FY2022:
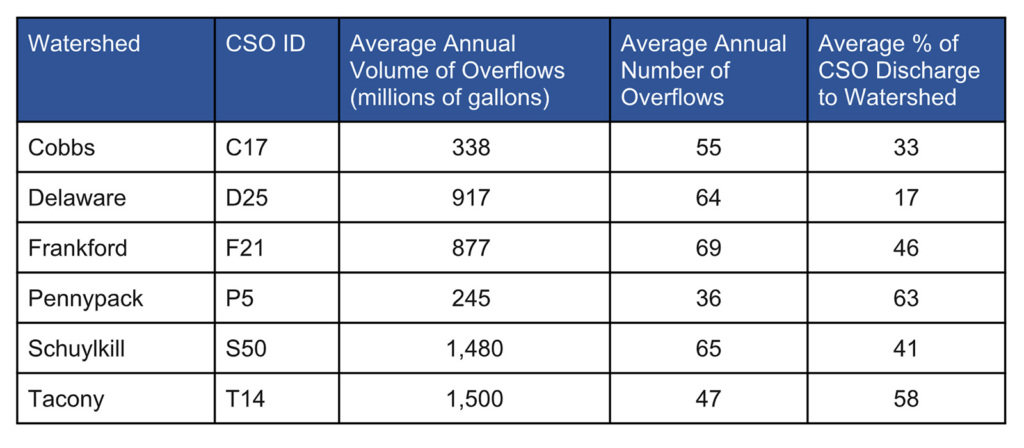
Figure 3: CSOs with the highest volume of overflows (annual average) in each local watershed [15]Photo by John Rumpler | TPIN
These pollution flows commonly contain pathogens, nutrients and toxic substances. Those pollutants are harmful to the Delaware River watershed and also pose health risks for swimmers and other water recreators. Public health experts estimate more than 86 million cases of illness each year from swimming, boating and fishing in polluted waters in the United States [18]. Bacteria, parasites and viruses in sewage can cause lung and intestinal infections; diarrhea, cramps, vomiting and loss of appetite; fever, headache and weakness; worsened allergies; and other illnesses [19].
A recent analysis by public health researchers at Temple University underscored the role of combined sewer overflows in elevating these health risks. In comparing pathogen risks at a set of local waterways, the researchers found that only the CSO-impacted waterways (Tacony and Cobbs Creeks) had average risks exceeding the U.S. Environmental Protection Agency’s (EPA) benchmark for illness from water recreation [20].
Needless to say, raw sewage and polluted stormwater are also harmful to the ecology of our rivers and streams – subjecting fish and wildlife to harmful algal outbreaks, a lack of oxygen and toxic substances [21].
After decades of massive sewage pollution, Pennsylvania Department of Environmental Protection (DEP) and the EPA brought enforcement actions against the City of Philadelphia for violations of the state Clean Streams law and the federal Clean Water Act, respectively. In consent orders with both agencies (in 2011 and 2012), Philadelphia committed to a 25-year Long Term Control Plan Update, often referred to as the Green City, Clean Waters plan [22]. While eschewing a comprehensive overhaul of the conventional sewage system, the city’s plan made bold commitments to green infrastructure – measures such as rain gardens, tree trenches and swales [23] that aim to restore some of nature’s capacity to absorb stormwater before it overwhelms sewers or pollutes rivers with runoff.
In 2022, the Green City, Clean Waters plan marked its 10-year point – with completed work including hundreds of green infrastructure projects and repairs to leaky pipes [24]. Unfortunately, as shown above, Philadelphia’s combined sewers are still overflowing all too frequently and at high volumes.
To be sure, Philadelphia’s plan has reduced sewage pollution to a degree. After more than a decade of work, the Philadelphia Water Department (PWD) estimated that its system repairs and green infrastructure projects had reduced CSO volume by a cumulative total of 3 billion gallons by 2021 [25]. The volume of combined sewage overflows is slowly declining relative to precipitation, as shown in Figure 4. In the 13 years from 2010 to 2022. CSOs per inch of precipitation declined during this period from a rolling 3-year average of roughly 333 million gallons to about 273 million gallons – a decrease of about 18 percent [26].
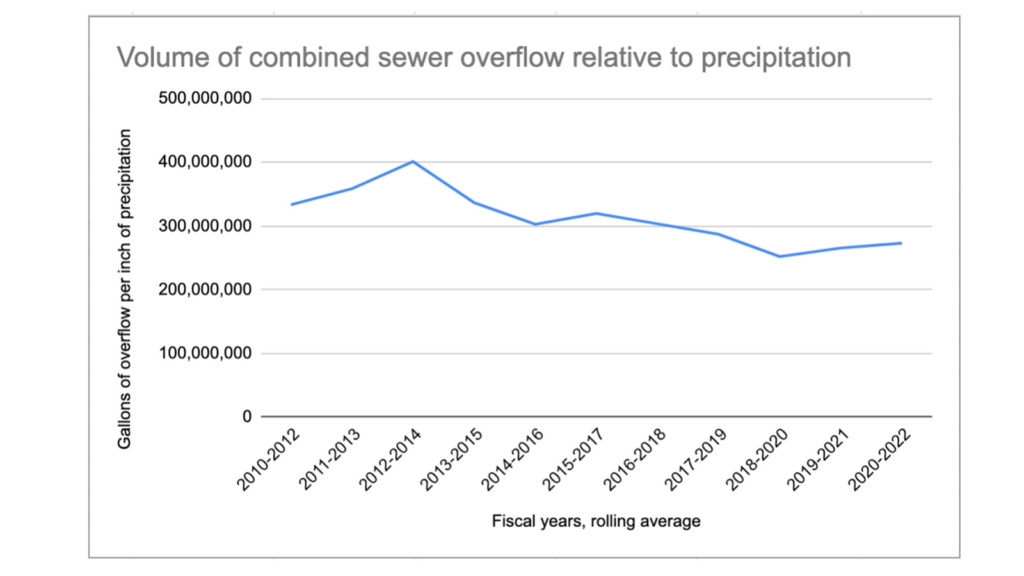
Figure 4: Combined Sewer Overflows are slowly declining relative to precipitationPhoto by John Rumpler | TPIN
Yet at this rate of progress, Philadelphians will, under the best of circumstances, be waiting for decades before their rivers and creeks are clean enough for full recreation. Moreover, such slow progress is likely to be significantly eroded by increased rainfall in the years ahead, due to climate change. Annual precipitation totals from 2000 to 2020 were nearly 5 inches higher than during the 1971 to 2000 period, and annual rainfall could increase by 8% by midcentury [27]. In fact, the Philadelphia metro area is now expected to be a hotspot for more intense rainfall in the future [28]. Researchers at the RAND Corporation estimate that the additional climate-related precipitation will cause a greater volume of sewage overflows [29].
The Delaware River watershed is a treasure for the entire region. This incredible resource allows us to envision a future for Philadelphia where residents can regularly enjoy cooling off in local rivers and streams – as people in other world-class cities increasingly are able to do [30].
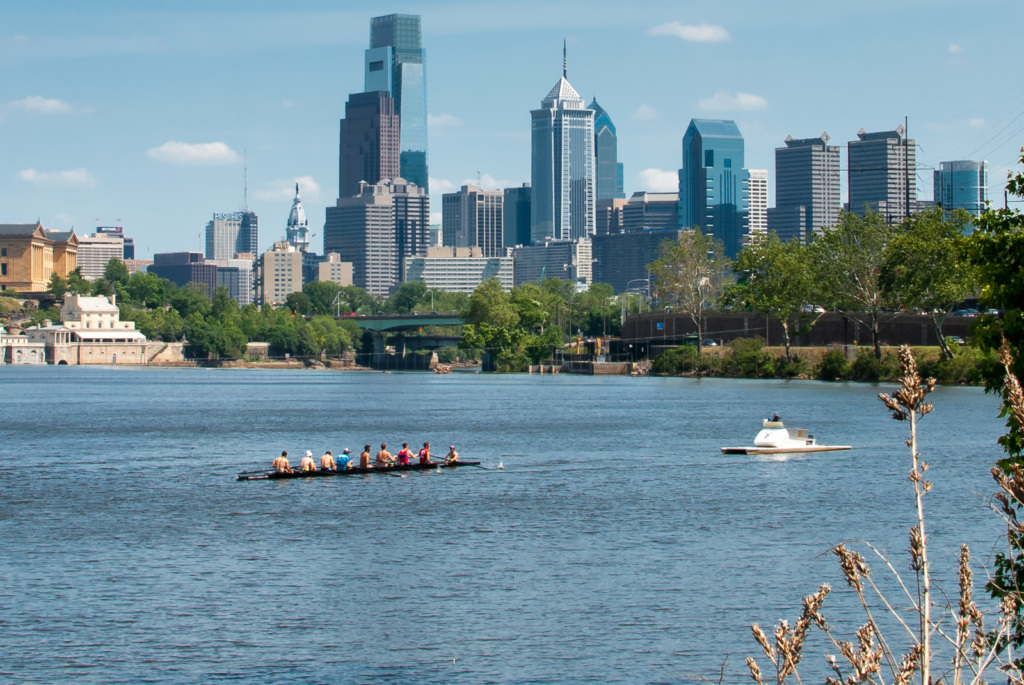
The Schuylkill RiverPhoto by Peter M Logan | CC-BY-SA-4.0
But as data from the city’s combined sewer overflows show, simply continuing to implement the Long Term Control Plan Update is unlikely to achieve this clean water future. Instead, we must aim higher. Consistent with the Clean Water Act’s goal of making all waterways safe for swimming, state and local leaders should commit to ending all sewer overflows and set a deadline for achieving that objective.
To realize this clean water future, Philadelphia officials should take the following actions:
Philadelphia will not be able to achieve this clean water future on its own. The Delaware River watershed is a regional resource, and ending sewage pollution will require bold action at all levels of government.
Above all, stopping combined sewer overflows will require significantly more resources than are currently committed to the Green City, Clean Waters program. Thanks to the Infrastructure Investment and Jobs Act (also known as the Bipartisan Infrastructure Law), Pennsylvania is receiving $70.5 million through the Clean Water State Revolving Fund (SRF) – the largest federal program for funding sewer and stormwater projects. In 2022, Pennsylvania allocated more than $200 million for water and sewer projects through the H2O PA Program and several million dollars to stormwater management grants [31]. Yet it is far from clear whether Philadelphia will receive its fair share of these funding streams. State officials must ensure that communities facing the greatest pollution problems – including Philadelphia – can access grant funding through the Clean Water SRF and other programs.
Suburban communities must be partners in ending regional sewage pollution as well. They should drastically curb their wastewater flows to Philadelphia’s sewer system and/or contribute more resources to end this regional pollution problem. The same goes for industrial users sending wastewater to the city’s system. And at the federal level, Congress should commit the additional $14.65 billion it authorized for the Clean Water SRF in the bipartisan infrastructure law.
While the task of cleaning the Delaware is daunting, there is reason for hope. Some cities have already vanquished massive sewage pollution to make their rivers much cleaner. Portland (Oregon) has reduced combined sewer overflows into the Willamette River by 94 percent [32]. Boston has largely left its “Love that Dirty Water” legacy behind, with water quality in the Charles River safe for swimming on most days [33]. Other cities are not far behind; for example, Washington DC is now committed to a 96 percent reduction in sewage overflows by 2030 [34]. With sufficient leadership and political will, Philadelphia can join them.
The authors wish to thank Nick Pagon and Tim Dillingham for their review of this document, as well as their insights and suggestions. Thanks to Nick Pagon and Ori Steinfink for research assistance, to Elizabeth Ridlington of Frontier Group for data analysis, and to Ben Silver for data visualization.
Environment America Research & Policy Center thanks the American Littoral Society and the William Penn Foundation for making this report possible. The author bears responsibility for any factual errors. Policy recommendations are those of Environment America Research & Policy Center. The views expressed in this report are those of our organization and do not necessarily reflect the views of our funders or those who provided review.
2022 Environment America Research & Policy Center. Some Rights Reserved. This work is licensed under a Creative Commons Attribution Non-Commercial No Derivatives 3.0 Unported License. To view the terms of this license, visit creativecommons.org/licenses/by-nc-nd/3.0.
Environment America Research & Policy Center is a 501(c)(3) organization. We are dedicated to protecting our air, water and open spaces. We investigate problems, craft solutions, educate the public and decision-makers, and help the public make their voices heard in local, state and national debates over the quality of our environment and our lives. For more information, please visit our website at www.environmentamericacenter.org.
Clean Water Director and Senior Attorney, Environment America
John directs Environment America's efforts to protect our rivers, lakes, streams and drinking water. John’s areas of expertise include lead and other toxic threats to drinking water, factory farms and agribusiness pollution, algal blooms, fracking and the federal Clean Water Act. He previously worked as a staff attorney for Alternatives for Community & Environment and Tobacco Control Resource Center. John lives in Brookline, Mass., with his family, where he enjoys cooking, running, playing tennis, chess and building sandcastles on the beach.