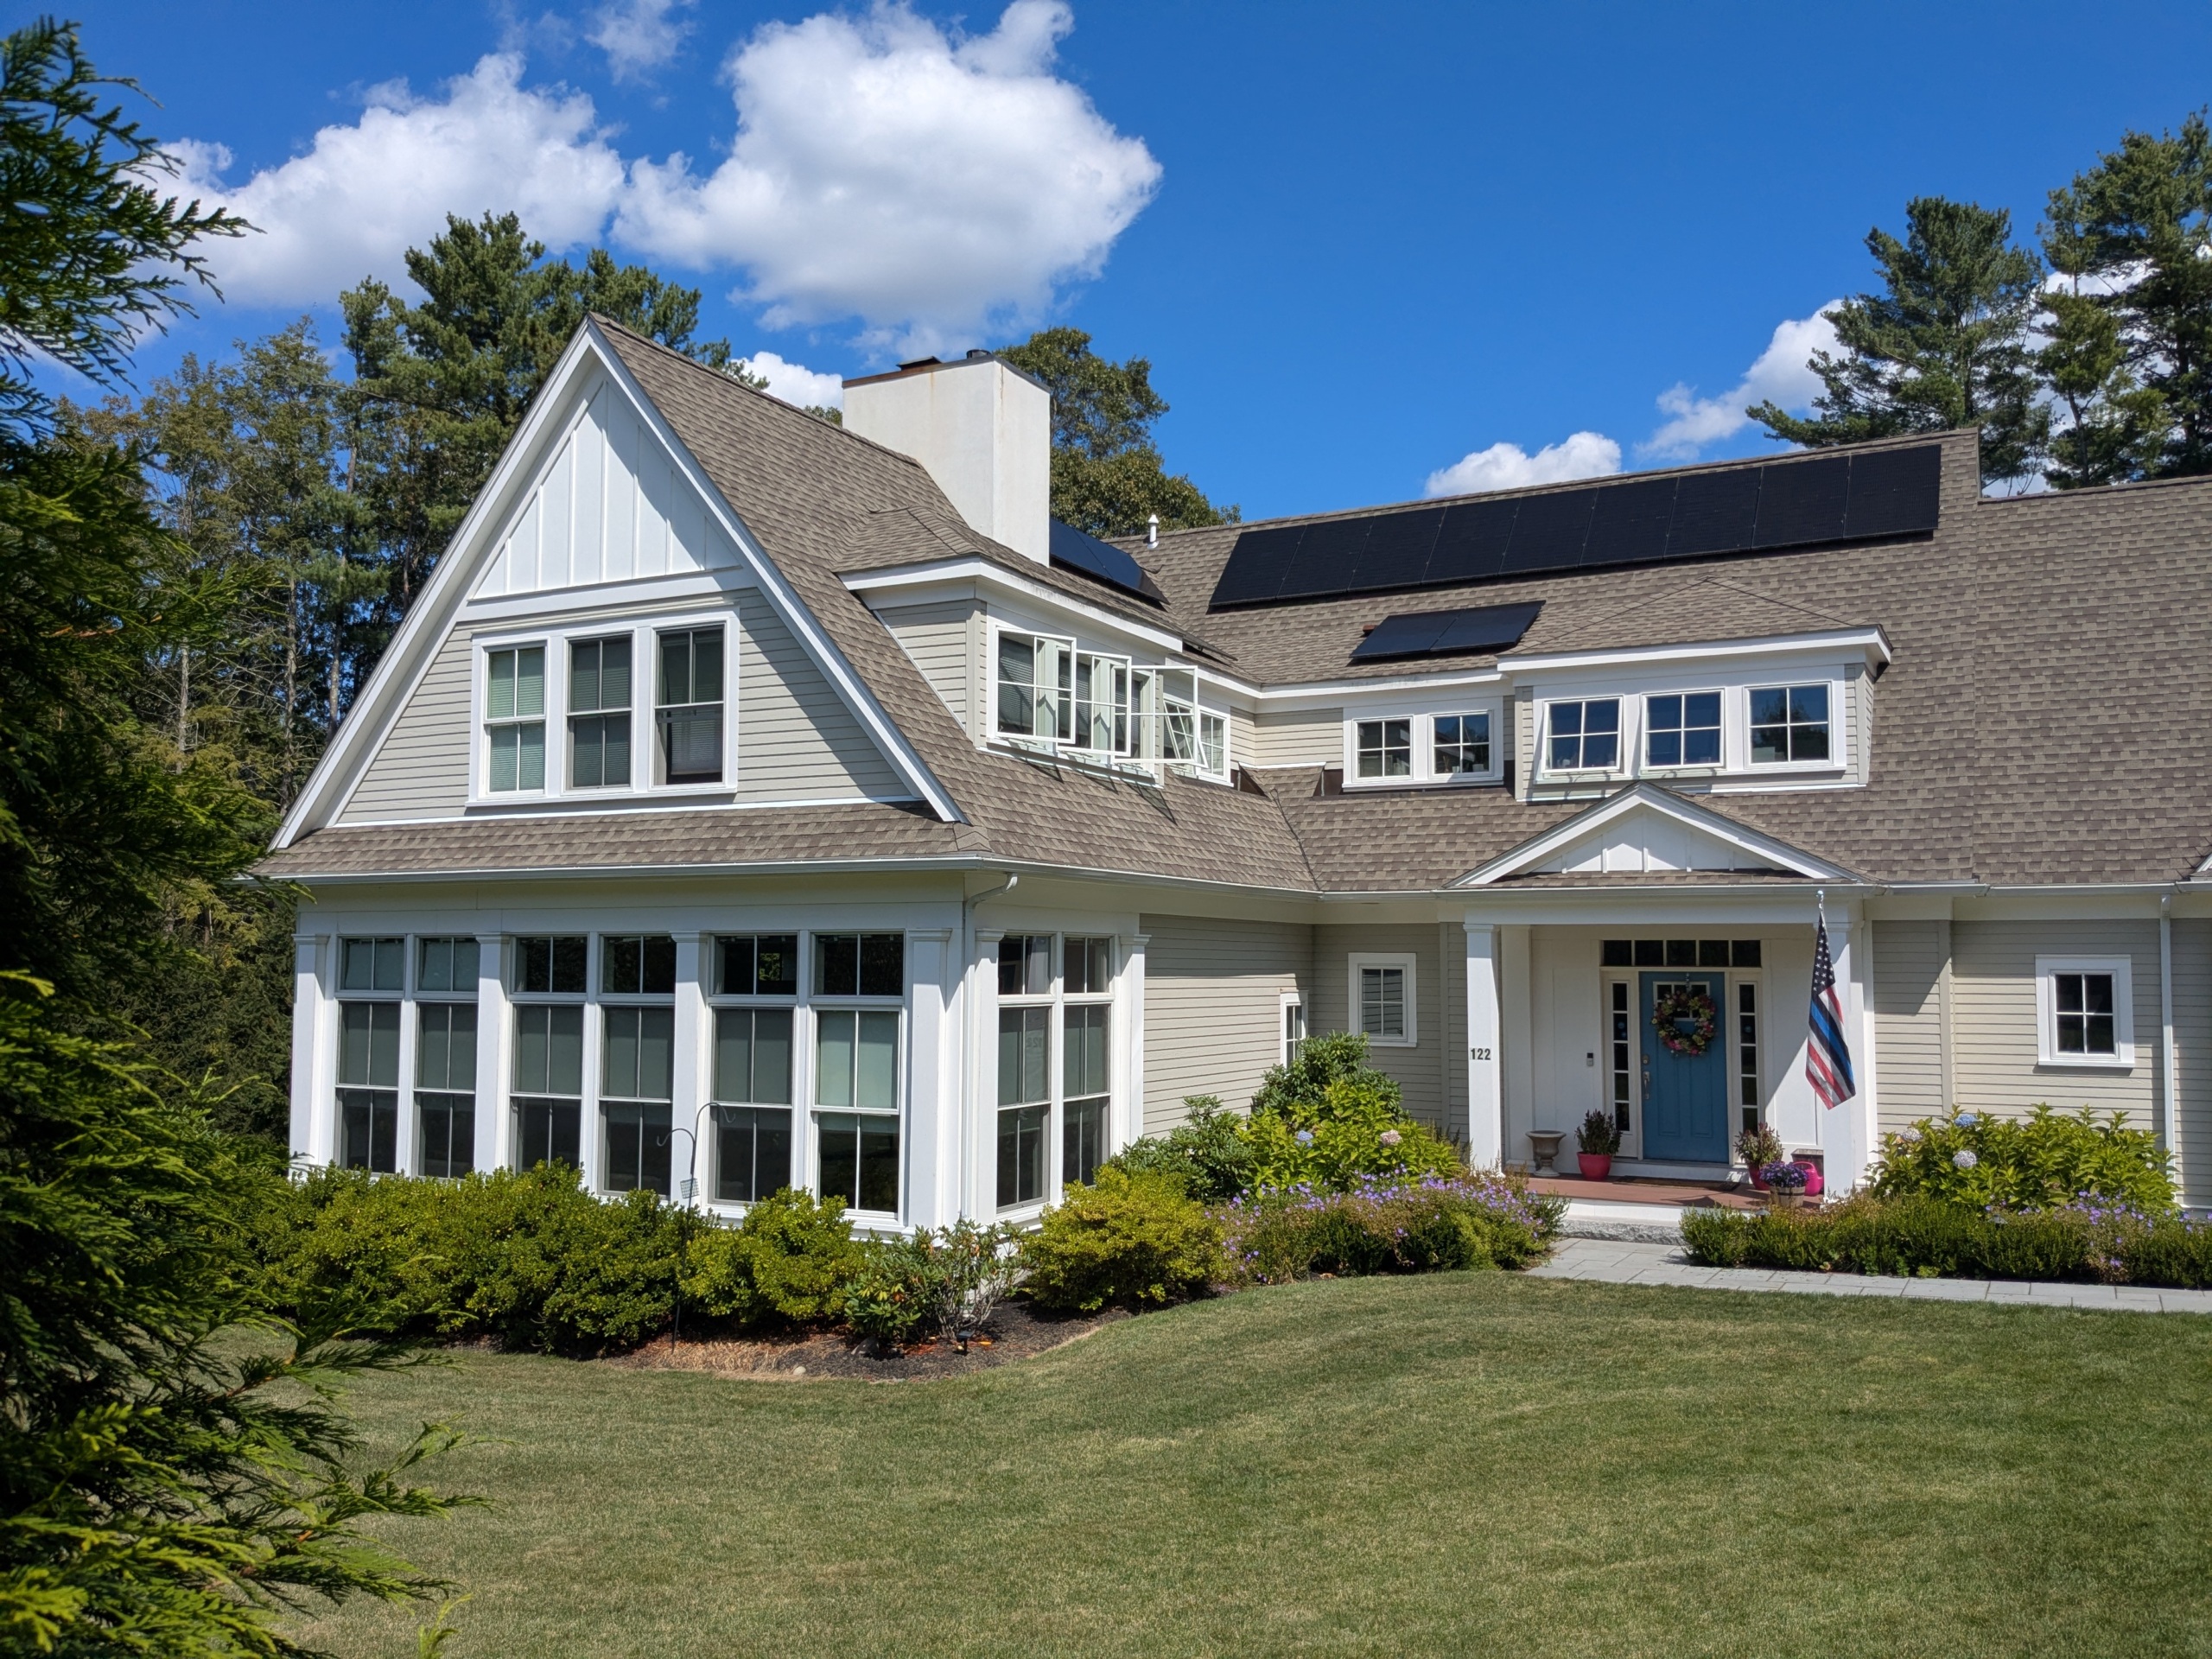

Renewables are on the rise across America. America produces more than three times as much power from solar, wind and geothermal sources as we did 10 years ago – enough to power more than 80 million homes. Key technologies such as electric vehicles and battery storage are also growing.
The State of Renewable Energy dashboard allows you to track the growth of clean energy in your state and around the country. Explore your state’s renewable energy progress, then read below for more information on the benefits of clean energy … and what local and state governments can do to help accelerate the transition.
Renewable energy brings cleaner air and water while cutting global warming pollution.
Wind and solar power reduce our dependence on polluting fossil fuels, with big benefits for our environment and health. The solar and wind power we’ve already installed in the U.S. has:
How much did America’s renewable energy and clean energy technologies grow in the last 10 years? Find out below.
America produced enough wind energy to power more than 43 million typical homes in 2025 – twice as much wind energy as in 2016.
America produced enough solar energy to power 36 million homes in 2025 – seven times as much solar energy as in 2016.
America had 43 gigawatts of battery energy storage at the end of 2025, 77 times as much as in 2016 and 58 percent more than at the end of 2024, helping to support the use of more renewable energy and keep the lights on during extreme weather and times of grid stress.
Energy efficiency improvements installed in 2024 will save 281 terawatt-hours of power over their lifetimes – enough to power 26 million homes for a year.
There were 4.5 million electric vehicles on American roads at the end of 2024 – a 16-fold increase from 2016. Meanwhile, the number of electric vehicle charging ports nationwide exceeded 238,000 at the end of 2025 – a more than fivefold increase from 2016.
Making the renewable future a reality: Recommendations for state and local governments
The past decade has seen exciting progress in clean energy. With continued progress and commitment, repowering America with clean, renewable energy is possible. To get there, state and federal governments should:
Click here for a downloadable fact sheet with information on clean energy progress in your state.
Utility-scale generation of electricity, utility-scale generation of wind and geothermal energy, and estimated combined utility- and small-scale solar energy generation: U.S. Energy Information Administration’s (EIA) form EIA-923 via the EIA’s Open Data API, viewable at https://www.eia.gov/opendata/browser/electricity/electric-power-operational-data.
Total retail sales of electricity: EIA’s forms EIA-826, EIA-861 and EIA-861M via the Open Data API, viewable at https://www.eia.gov/opendata/browser/electricity/retail-sales.
Electric vehicle registrations: Battery-electric vehicle registrations by state were obtained from the U.S. Department of Energy’s Alternative Fuels Data Center, accessible at https://afdc.energy.gov/vehicle-registration. Data for 2015 and 2025 were unavailable at the time of publication.
Electric vehicle charging ports: Based on historical counts of public charging ports from the U.S. Department of Energy Alternative Fuel Data Center, Alternative Fueling Station Counts by State, accessed at https://afdc.energy.gov/stations/states. 2024 data are based on charging station counts as of December 31, 2024 and 2025 data are based on counts as of December 31, 2025.
Energy savings from energy efficiency programs: Based on all-sector, expected lifetime annual energy savings for 2024 from EIA’s form EIA-861 via the Open Data API, viewable at https://www.eia.gov/opendata/browser/electricity/state-electricity-profiles/energy-efficiency. These savings represent the expected savings from efficiency measures installed during 2024, and do not include savings from projects installed in previous years. The figures presented here represent savings at customer meters, not savings during generation, transmission or distribution of electricity: U.S. Energy Information Administration, Form EIA-861 Annual Electric Power Industry Report Instructions, p. 14, accessed July 31, 2023 at https://www.eia.gov/survey/form/eia_861/proposed/2023/instructions.pdf.
Battery capacity: Based on nameplate capacity of operable generators using battery technology from December of the years analyzed, compiled from EIA’s forms EIA-860 and EIA-860M via the Open Data API, viewable at https://www.eia.gov/opendata/browser/electricity/operating-generator-capacity. Includes only utility-scale battery storage systems, not distributed storage.
Additional sources for state-by-state factsheets:
Residents adopting clean energy: All data from the 2025 Environment America Research & Policy Center/Frontier Group report Clean Energy Across America.
Renewable energy potential: Anthony Lopez et al., National Renewable Energy Laboratory, Renewable Energy Technical Potential and Supply Curves for the Contiguous United States: 2024 Edition, revised June 2025, pages 59-64. Data reflect the “reference access” scenario, described as a “moderate scenario” that “applies existing ordinances and regulations, known preclusions, and current industry practices for siting.” Data for wind power potential include land-based and fixed and floating offshore turbines. Data for wind power potential in Massachusetts in the original report were in error; corrected data were supplied by a co-author of the report via personal communication in March 2026.
The rapid demand growth electricity consumption scenario for 2050 was based on the National Laboratory of the Rockies, Standard Scenarios 2024, downloaded from https://scenarioviewer.nlr.gov/ on March 30, 2026. The scenario used is “High_Demand_Growth_CO2e_100by2035”, policy type “Decarb_CO2e_100by2035.” For more details, see Pieter Gagnon, National Renewable Energy Laboratory, 2024 Standard Scenarios Report: A U.S. Electricity Sector Outlook, December 2024.
Senior Director, Campaign for 100% Renewable Energy, Environment America Research & Policy Center
Johanna directs strategy and staff for Environment America's energy campaigns at the local, state and national level. In her prior positions, she led the campaign to ban smoking in all Maryland workplaces, helped stop the construction of a new nuclear reactor on the shores of the Chesapeake Bay and helped build the support necessary to pass the EmPOWER Maryland Act, which set a goal of reducing the state’s per capita electricity use by 15 percent. She also currently serves on the board of Community Action Works. Johanna lives in Amherst, Massachusetts, with her family, where she enjoys growing dahlias, biking and the occasional game of goaltimate.
Associate Director and Senior Policy Analyst, Frontier Group
Tony Dutzik is associate director and senior policy analyst with Frontier Group. His research and ideas on climate, energy and transportation policy have helped shape public policy debates across the U.S., and have earned coverage in media outlets from the New York Times to National Public Radio. A former journalist, Tony lives and works in Boston.